Figure 3 of
Raju, Mol Vis 2011; 17:7-15.
Figure 3.
Relative elution profile of αAG98R-crystallin subunits during size exclusion chromatography on TSK-3000 PW
XL
column (7.6 mm×30 cm). 1) BSA (66 kDa); 2) Carbonic anhydrase (29 kDa); 3) αAG98R-crystallin and 4) lysozyme (14.6 kDa).
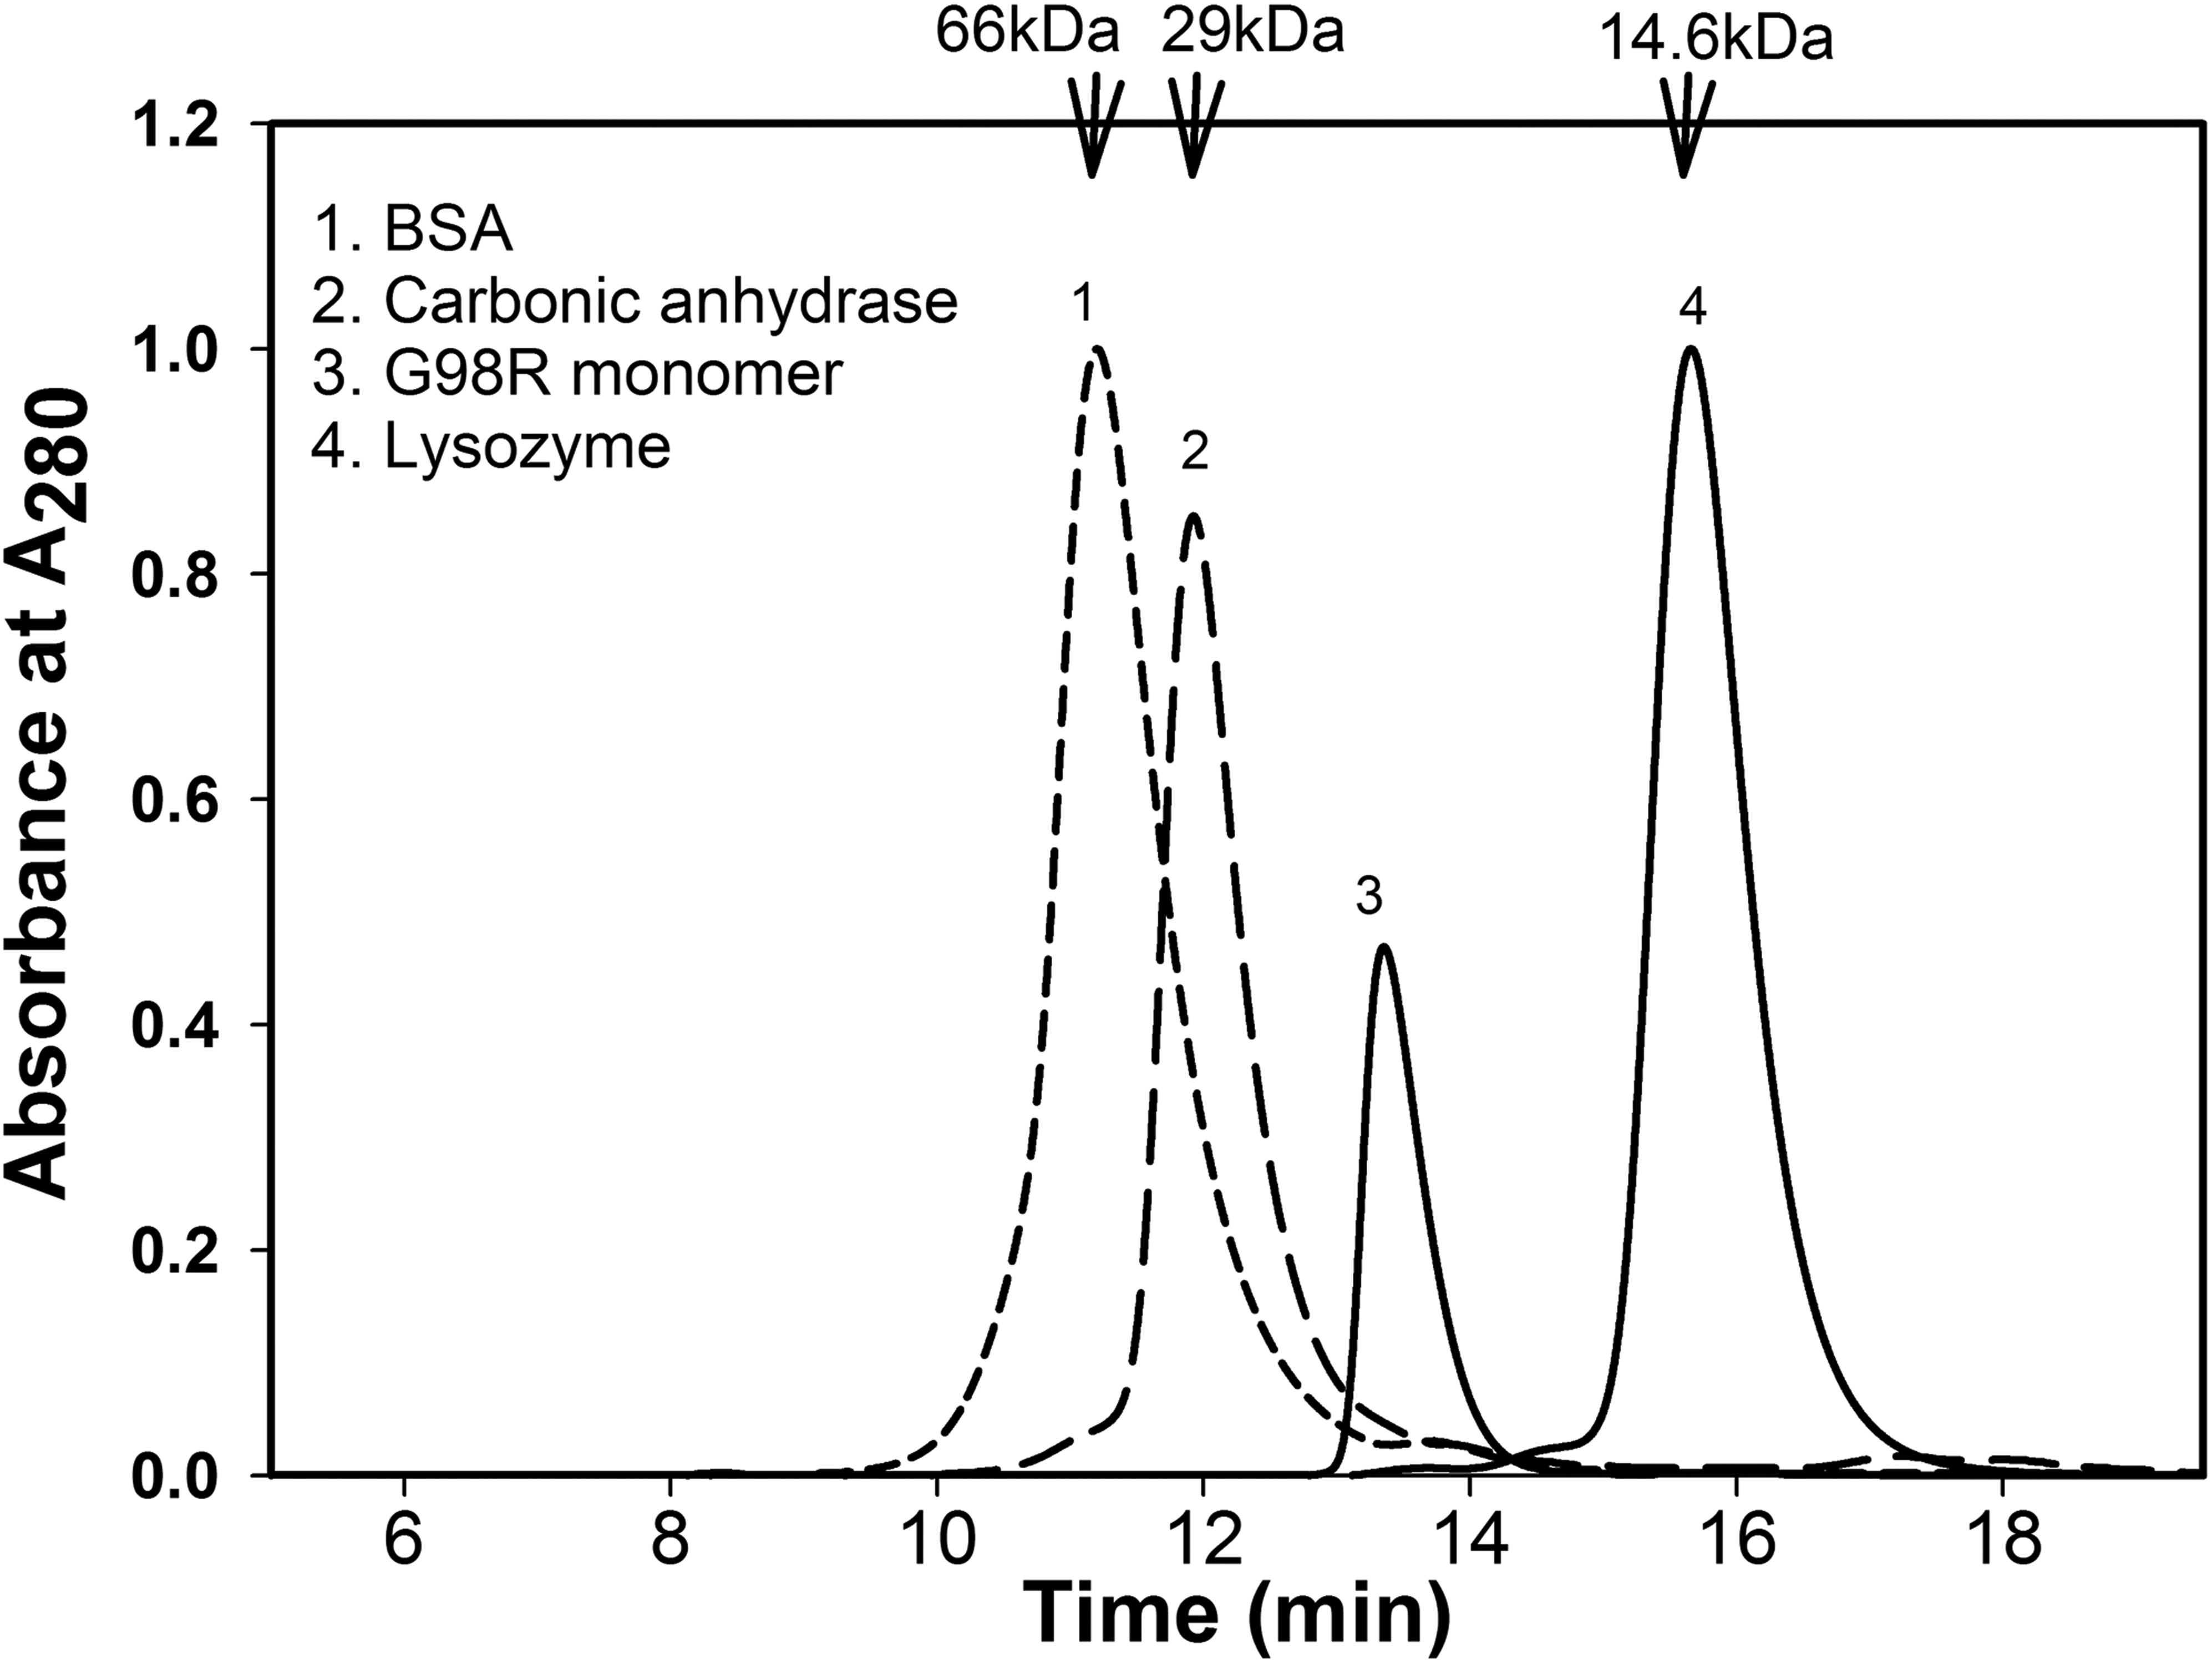
 Figure 3 of Raju, Mol Vis 2011; 17:7-15.