Figure 2. Percent of live trabecular
meshwork (TM) cells after a 25 min exposure to various commercially
available prostaglandin analogs (diluted 1:10 in serum-free media). The
number of live cells was normalized to the number of live cells in
BSS-treated controls. Data are reported as the mean±standard deviation
of n=6 replicates. *=p<0.05 versus BSS control; †=p<0.05 versus
travoprost/timolol + PQ; ‡=p<0.05 versus BAK alone.
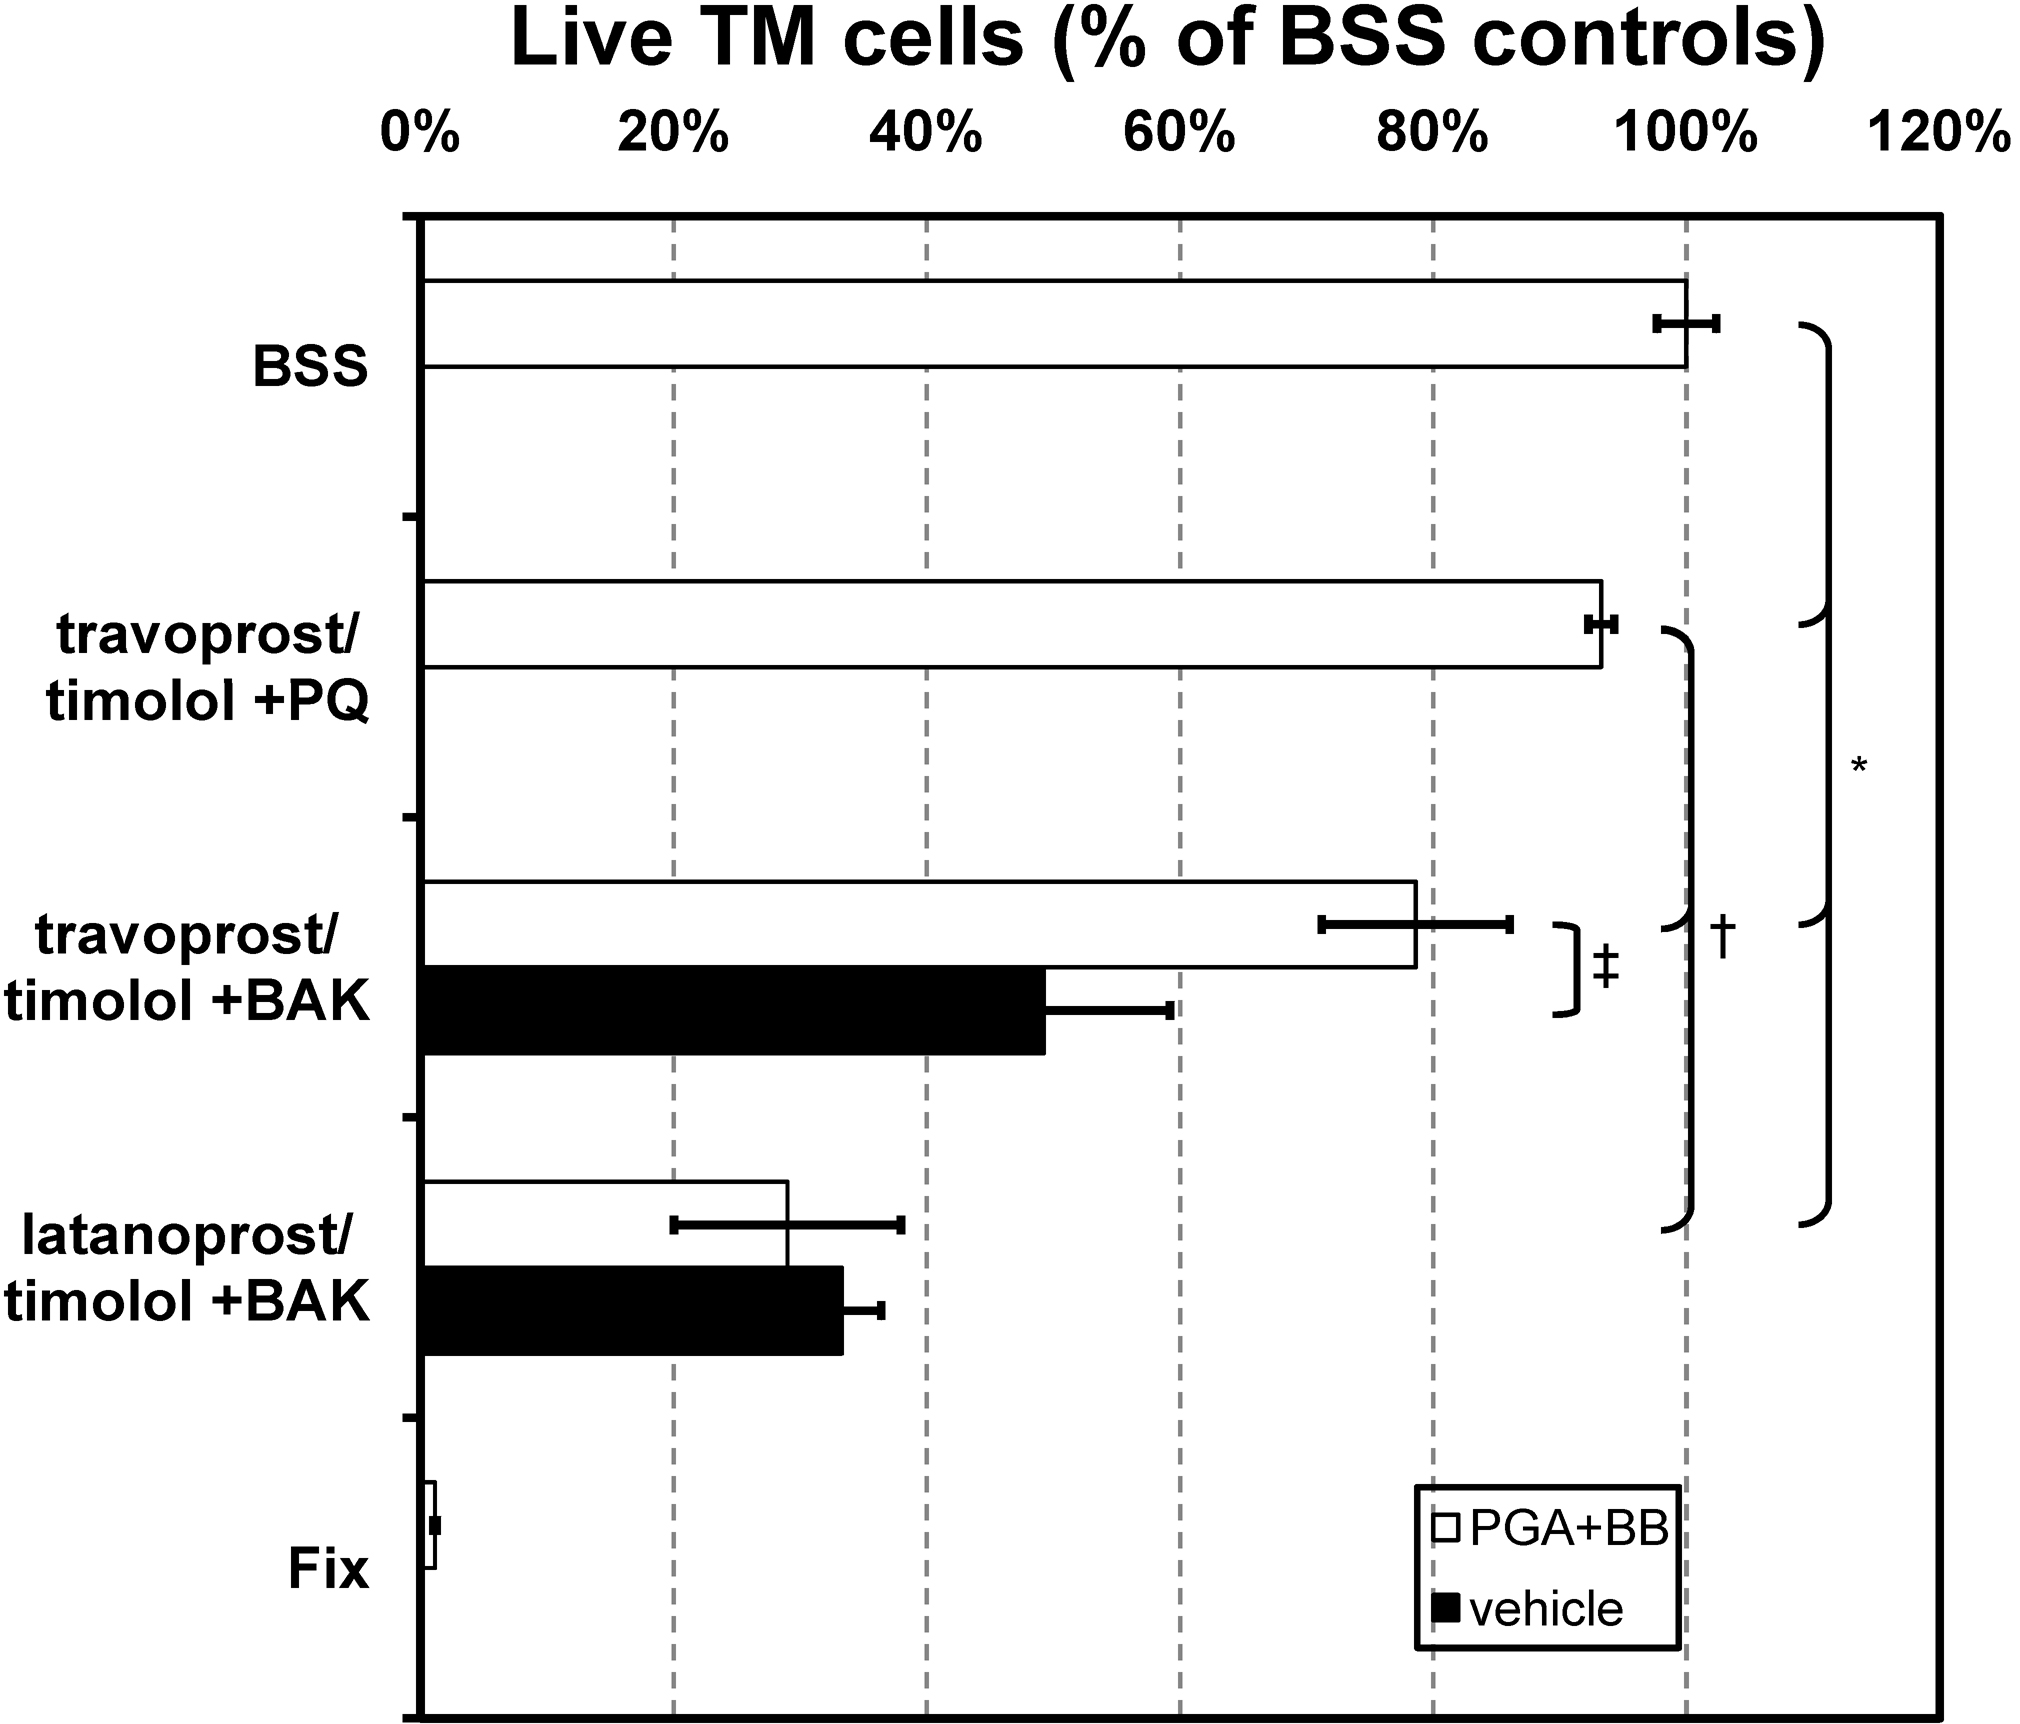
 Figure 2 of Ammar, Mol Vis 2011; 17:1806-1813.