Figure 6. Structures and effective concentrations of nicotiflorin, rutin, and quercitrin against the three stresses. Note the difference
in side chains enclosed by rectangles. P-value<0.05 by calculated in Dunnett's tests compared to stress only. The result showed
that neuroprotective concentration of quercitrin is different with nicotiflorin and rutin. It is shown that different structures
of changing side chain induced different concentrations of neuroprotection.
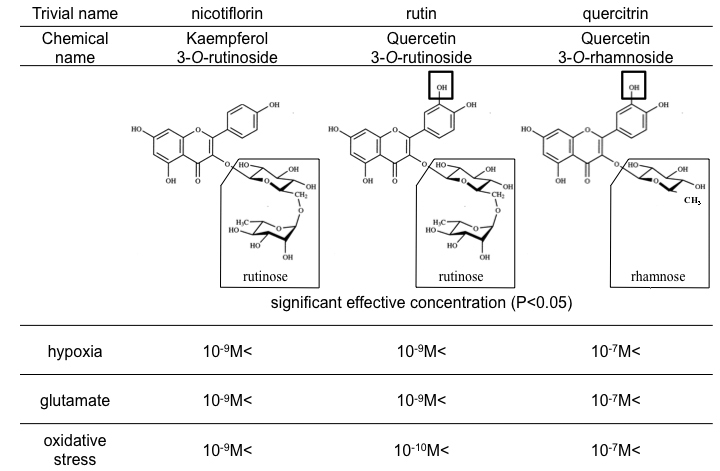
 Figure 6 of
Nakayama, Mol Vis 2011; 17:1784-1793.
Figure 6 of
Nakayama, Mol Vis 2011; 17:1784-1793.