Figure 1. Effects of nicotiflorin (A), rutin (B), and quercitrin (C) against hypoxia-induced retinal ganglion cell death. Each bar represents mean±standard deviation (SD; n=8). The asterisks
indicate p<0.05 versus hypoxia vehicle (black bar) by Dunnett’s tests.
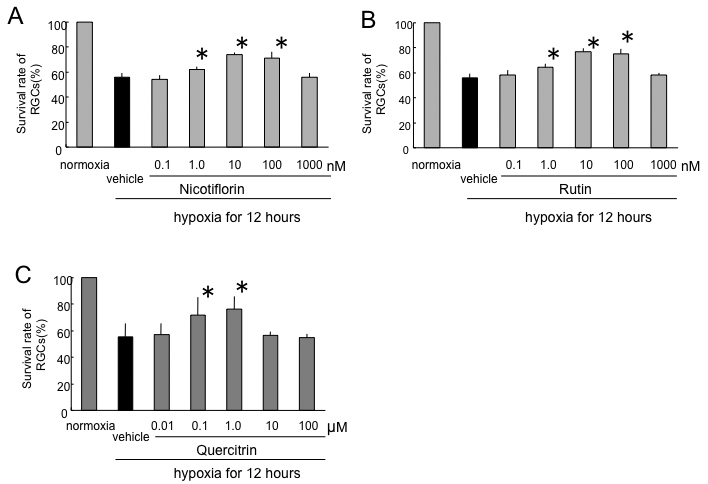
 Figure 1 of
Nakayama, Mol Vis 2011; 17:1784-1793.
Figure 1 of
Nakayama, Mol Vis 2011; 17:1784-1793.