Figure 8. Electroretinograms (ERGs) following intravitreal delivery of AAV2.CBA.eGFP vector and heparinase III or chondroitin ABC lyase.
A: Dark-adapted ERGs were intact following enzyme injection of heparinase III at 800 units. B: Dark-adapted ERGs were intact following enzyme injection of heparinase III at 1,600 units. C: Dark-adapted ERGs were intact following enzyme injection of chondroitin ABC lyase at 800 units. D: A higher dose of chondroitin ABC lyase (1,600 units) impaired retinal function. Records show average responses to repeated
flash presentations in individual mice. Timing of each flash is indicated by the arrow, with flash intensity (in log10 μW.cm−2) shown to the left of each ERG trace.
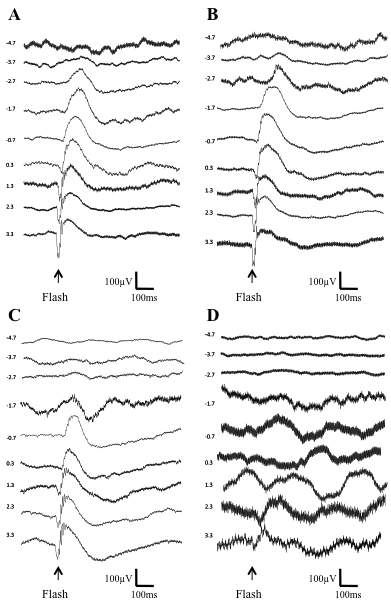
 Figure 8 of
Cehajic-Kapetanovic, Mol Vis 2011; 17:1771-1783.
Figure 8 of
Cehajic-Kapetanovic, Mol Vis 2011; 17:1771-1783.