Figure 7. Representative cross sectional
micrographs showing various retinal cell types transduced by
AAV2.CBA.eGFP after treatment with heparinase III. A-G:
After two weeks retinas treated with AAV2.CBA.eGFP vector and 200 units
of heparinase III showed GFP expression across all retinal layers
including cells with the anatomic location and morphology of (A-E,
G) ganglion cells, (A-G) INL cells, (D, E)
Müller cells, and (F, G) photoreceptor cells. FITC
filter is shown in the left panel; DAPI filter is shown in the right
panel. Calibration bar 50 µm. Ganglion cell layer (GCL), inner nuclear
layer (INL), outer nuclear layer (ONL), outer segments (OS). Green
arrow shows a retinal ganglion cell. Blue arrow shows a Müller cell.
Orange arrow shows a cell in inner nuclear layer. Red arrow shows a
photoreceptor cell.
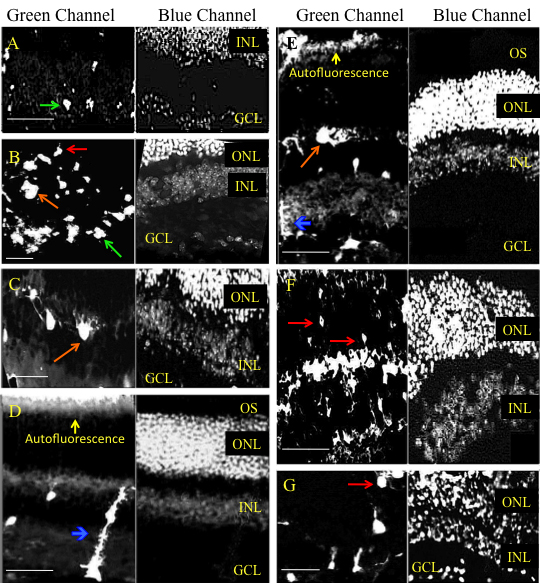
 Figure 7 of Cehajic-Kapetanovic, Mol Vis 2011; 17:1771-1783.