Figure 2. Retinal fluorescence two weeks after the intravitreal delivery of AAV2.CBA.eGFP and other different enzymes. A: Quantitative analysis of fluorescence following treatment with the AAV2 and collagenase, hyaluronan lyase, chondroitin ABC
lyase, or heparinase III in increasing concentrations. Data are geomeans with a ±95% CI (n=9 eyes), and show the percentage
fluorescence intensity relative to that induced by AAV2 alone (0 unit control group, n=3 eyes). B: Confocal projection of optical z-sections demonstrating fluorescence after co-injection with chondroitin ABC lyase at the
dose indicated. C: Confocal projection of optical z-sections demonstrating fluorescence after co-injection with heparinase III at the dose
indicated.
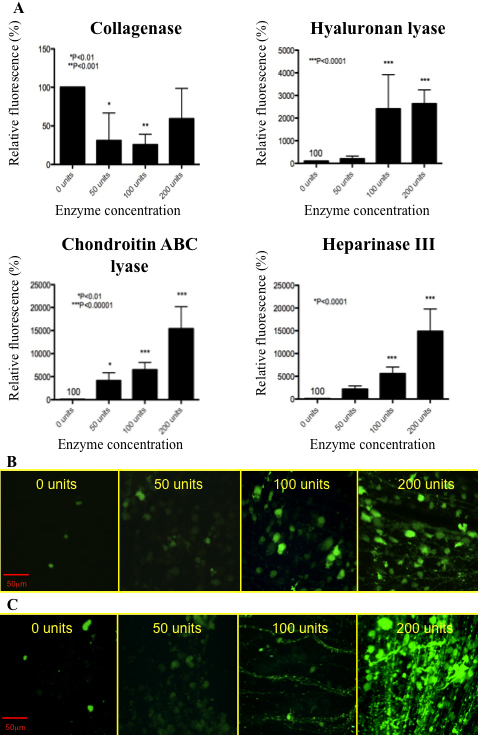
 Figure 2 of
Cehajic-Kapetanovic, Mol Vis 2011; 17:1771-1783.
Figure 2 of
Cehajic-Kapetanovic, Mol Vis 2011; 17:1771-1783.