Figure 1. Schematic representation of the methodology used to quantify GFP expression in mouse retina flatmounts. Confocal z-sectioning
(serial optical sections) was performed in areas of 238×238 μm at 1 μm intervals through the depth of the retina. All images
were captured under identical conditions of laser intensity, brightness and contrast. Slice image stacks were collapsed over
the z-axis into confocal projections using Leica Microsystems LAS AF software and processed with ImageJ software to measure
the total (GFP mediated) fluorescence in pixels per area through the retinal depth. For initial analyses of enzymes efficacy,
an area was selected at random in the mid-periphery of each quadrant (A), and for dose–response curves ten areas were selected along a randomly chosen straight extension across the retina (B). All analyses were conducted blind to the amount of enzyme used.
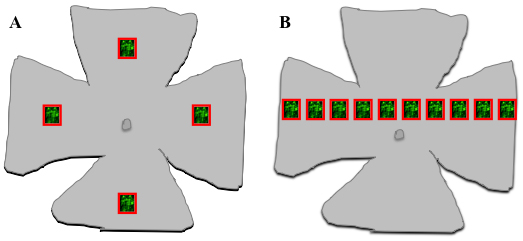
 Figure 1 of
Cehajic-Kapetanovic, Mol Vis 2011; 17:1771-1783.
Figure 1 of
Cehajic-Kapetanovic, Mol Vis 2011; 17:1771-1783.