Figure 4. Three weeks post transplantation
of murine retinal progenior cells (mRPCs) into Rho−/−
mice. The first row (A, B, C, D) and the
third row (I, J, K, L) were mRPCs groups
as control. The second row (E, F, G, H)
and the fourth row (M, N, O, P) were
chondroitinase ABC treated groups. Q: The average number of
cells in the retinal layers was counted per microscopic field. The
columns are mean values, error bars are SD *p<0.01 (n=9). The
chondroitin expression in F was lower than that in B.
Most cells migrated into the retinal layer when Chondroitinase ABC was
used (H, P). The cells express GFAP whether in the
subretinal space (L) or vitreous cavity (P). None of the
cells located in the retinal layers express GFAP. Scale bar: 20 μm (D,
H, L, P) Abbreviations: ganglion cell layer
(GCL); inner plexiform layer (IPL); inner nuclear layer (INL); outer
nuclear layer (ONL); and subretinal space (SRS).
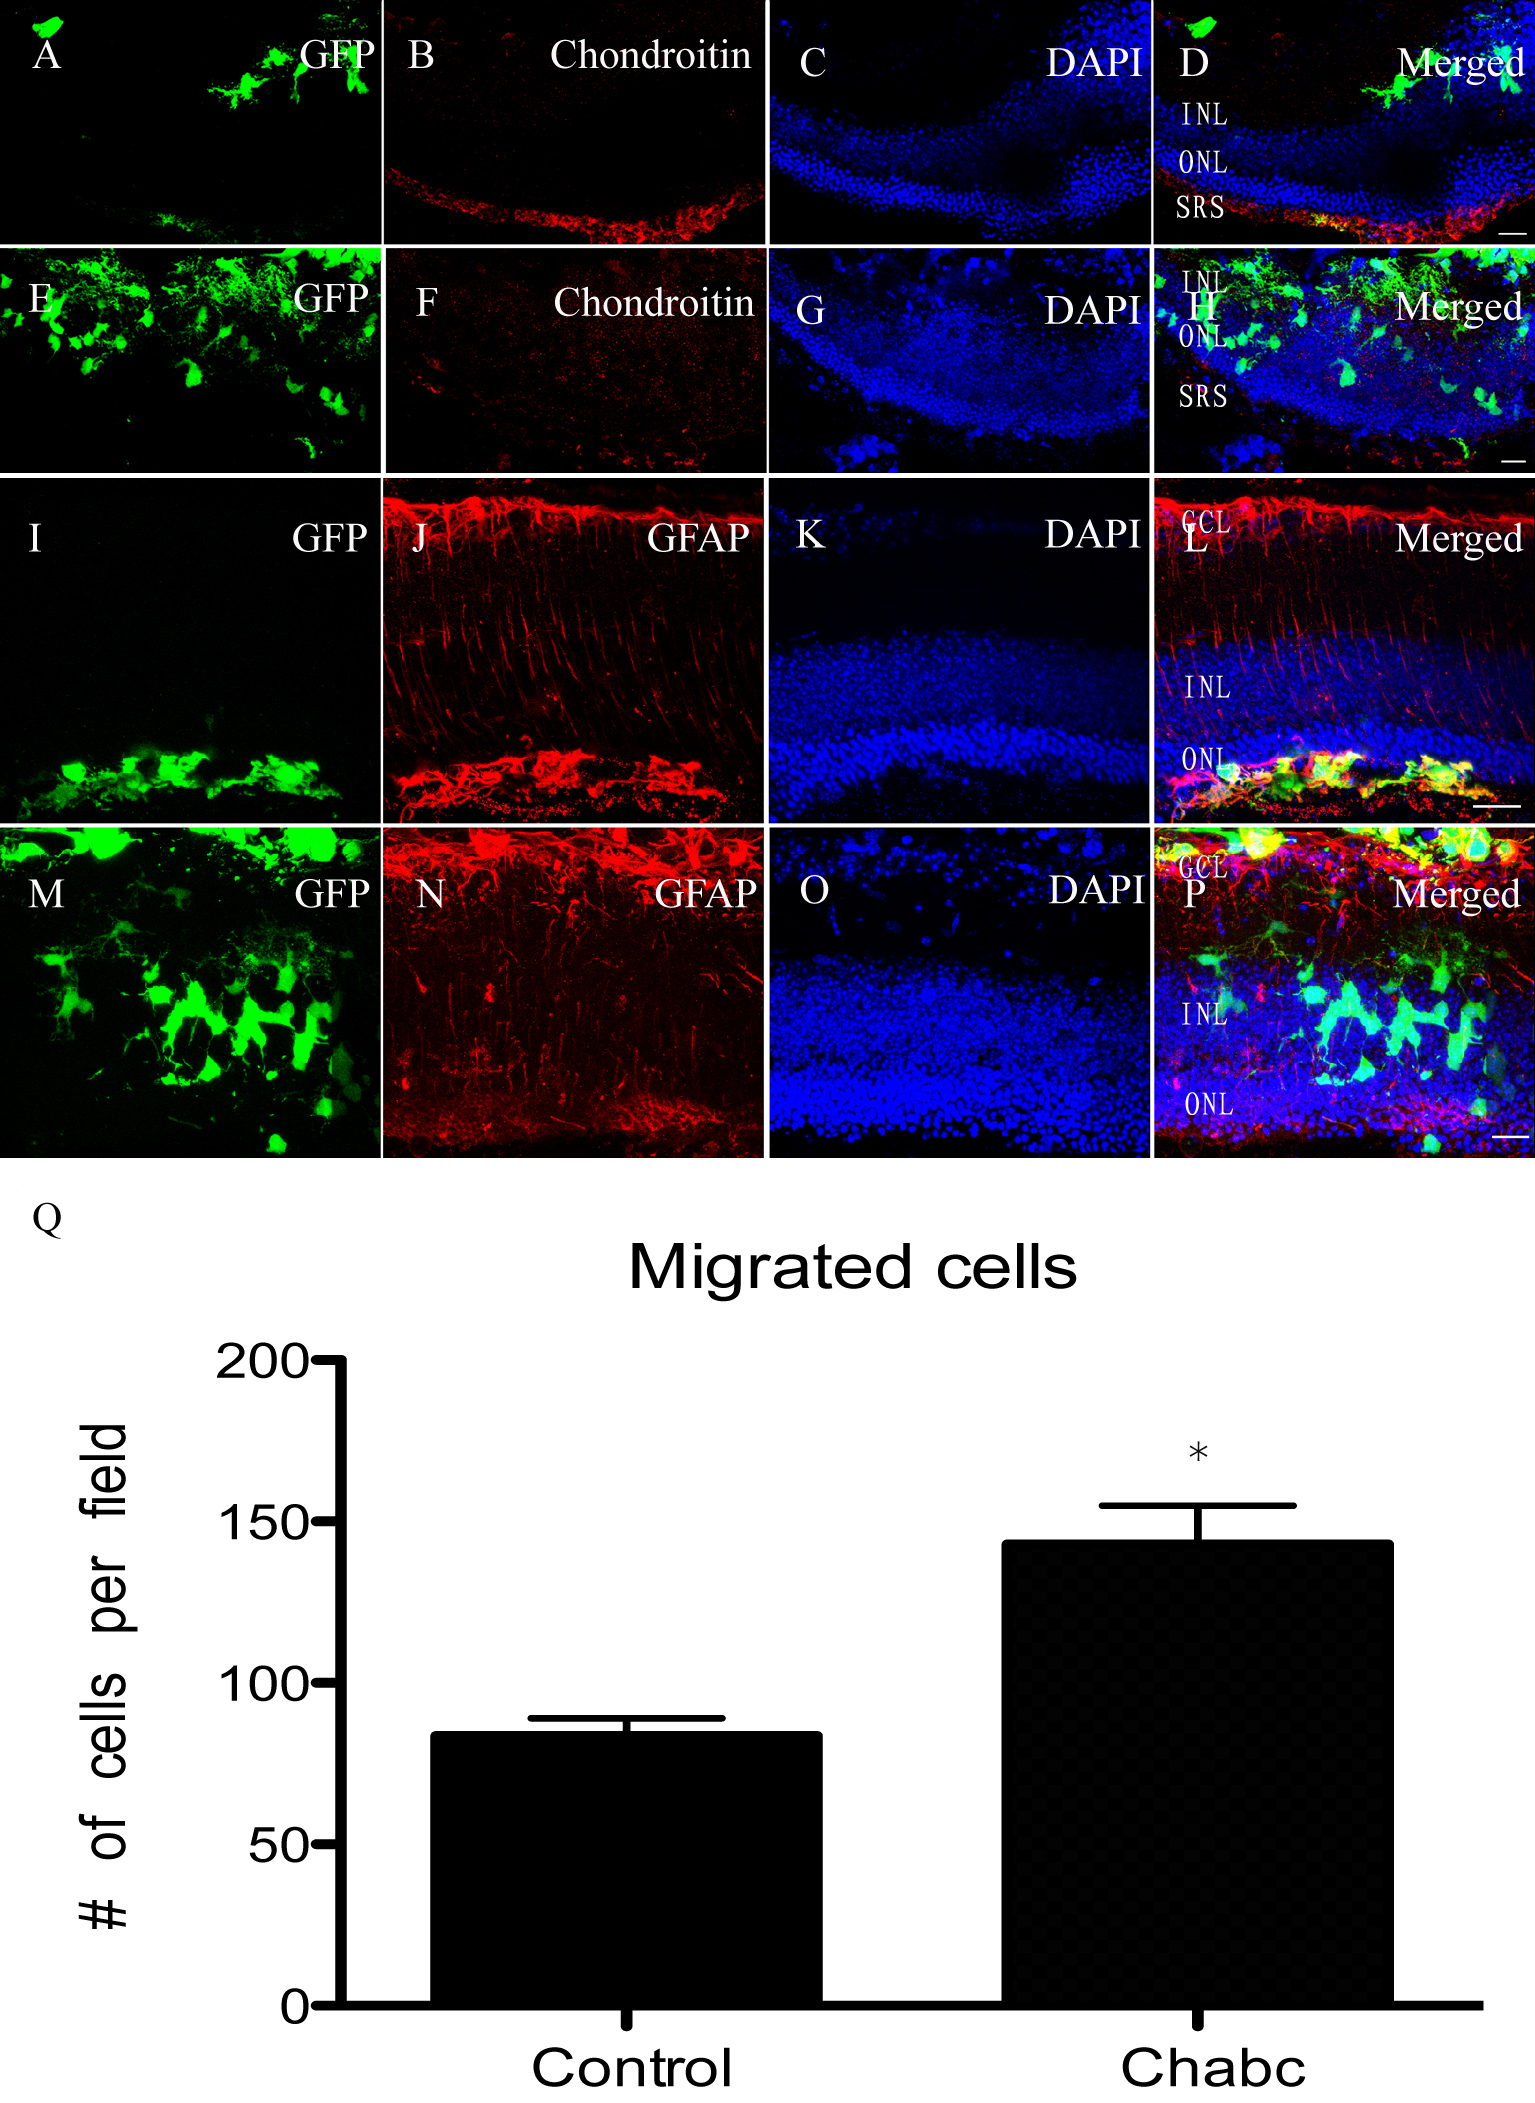
 Figure 4 of Ma, Mol Vis 2011; 17:1759-1770.