Figure 8. Effect of Smad2 or Smad3 siRNA
on transforming growth factor (TGF)-β2 stimulation of fibronectin (FN)
and plasminogen activator inhibitor (PAI)-1 in optic nerve head (ONH)
astrocytes and lamina cribrosa (LC) cells. A: ONH astrocytes
and LC cells were treated with small interfering RNA (siRNA) controls
(lane 1=Non-targeting siRNA; lane 2=RISC-Free siRNA) or with Smad3
siRNA (25 nM and 50 nM; lanes 4–5) for 48 h, and were then treated with
recombinant TGF-β2 (5 ng/ml) for 24 h. Cellular FN, PAI-1, total Smad3,
and actin were assessed by western blot. B: Relative densities
of Smad3 and actin in ONH astrocytes were measured using densitometric
analysis of the western blots. Smad3 was normalized to actin and the
fold change in Smad3 over the vehicle control was plotted (n=3,*
p<0.001 versus control). C and D: Relative FN or
PAI-1 was normalized to actin and the fold change in FN (C) or
PAI-1(D) over the vehicle control was plotted (n=3,* p<0.001
verses TGF-β2 treated). E: ONH astrocytes and LC cells were
treated with siRNA controls (lane 1=Non-targeting siRNA; lane
2=RISC-Free siRNA) or with Smad2 siRNA (lanes 4–5, 100 nM in duplicate)
for 48 h, and were then treated with recombinant TGF-β2 (5 ng/ml) for
24 h. F: Cellular FN, PAI-1, total Smad2, and actin were
assessed by western blot. Smad2 levels in ONH astrocytes were
normalized to actin and the fold change in Smad2 over the vehicle
control was plotted (n=3, *p<0.0018 verses control). G and H:
Relative
densities of FN, PAI-1, and actin were measured using
densitometric analysis. Relative densities of FN or PAI-1 were
normalized to actin and the fold change in FN (G) or PAI-1(H)
over
vehicle the control was plotted (n=3, p<0.0048 for FN and
p<0.0015 for PAI-1, * verses TGF-β2 treated).
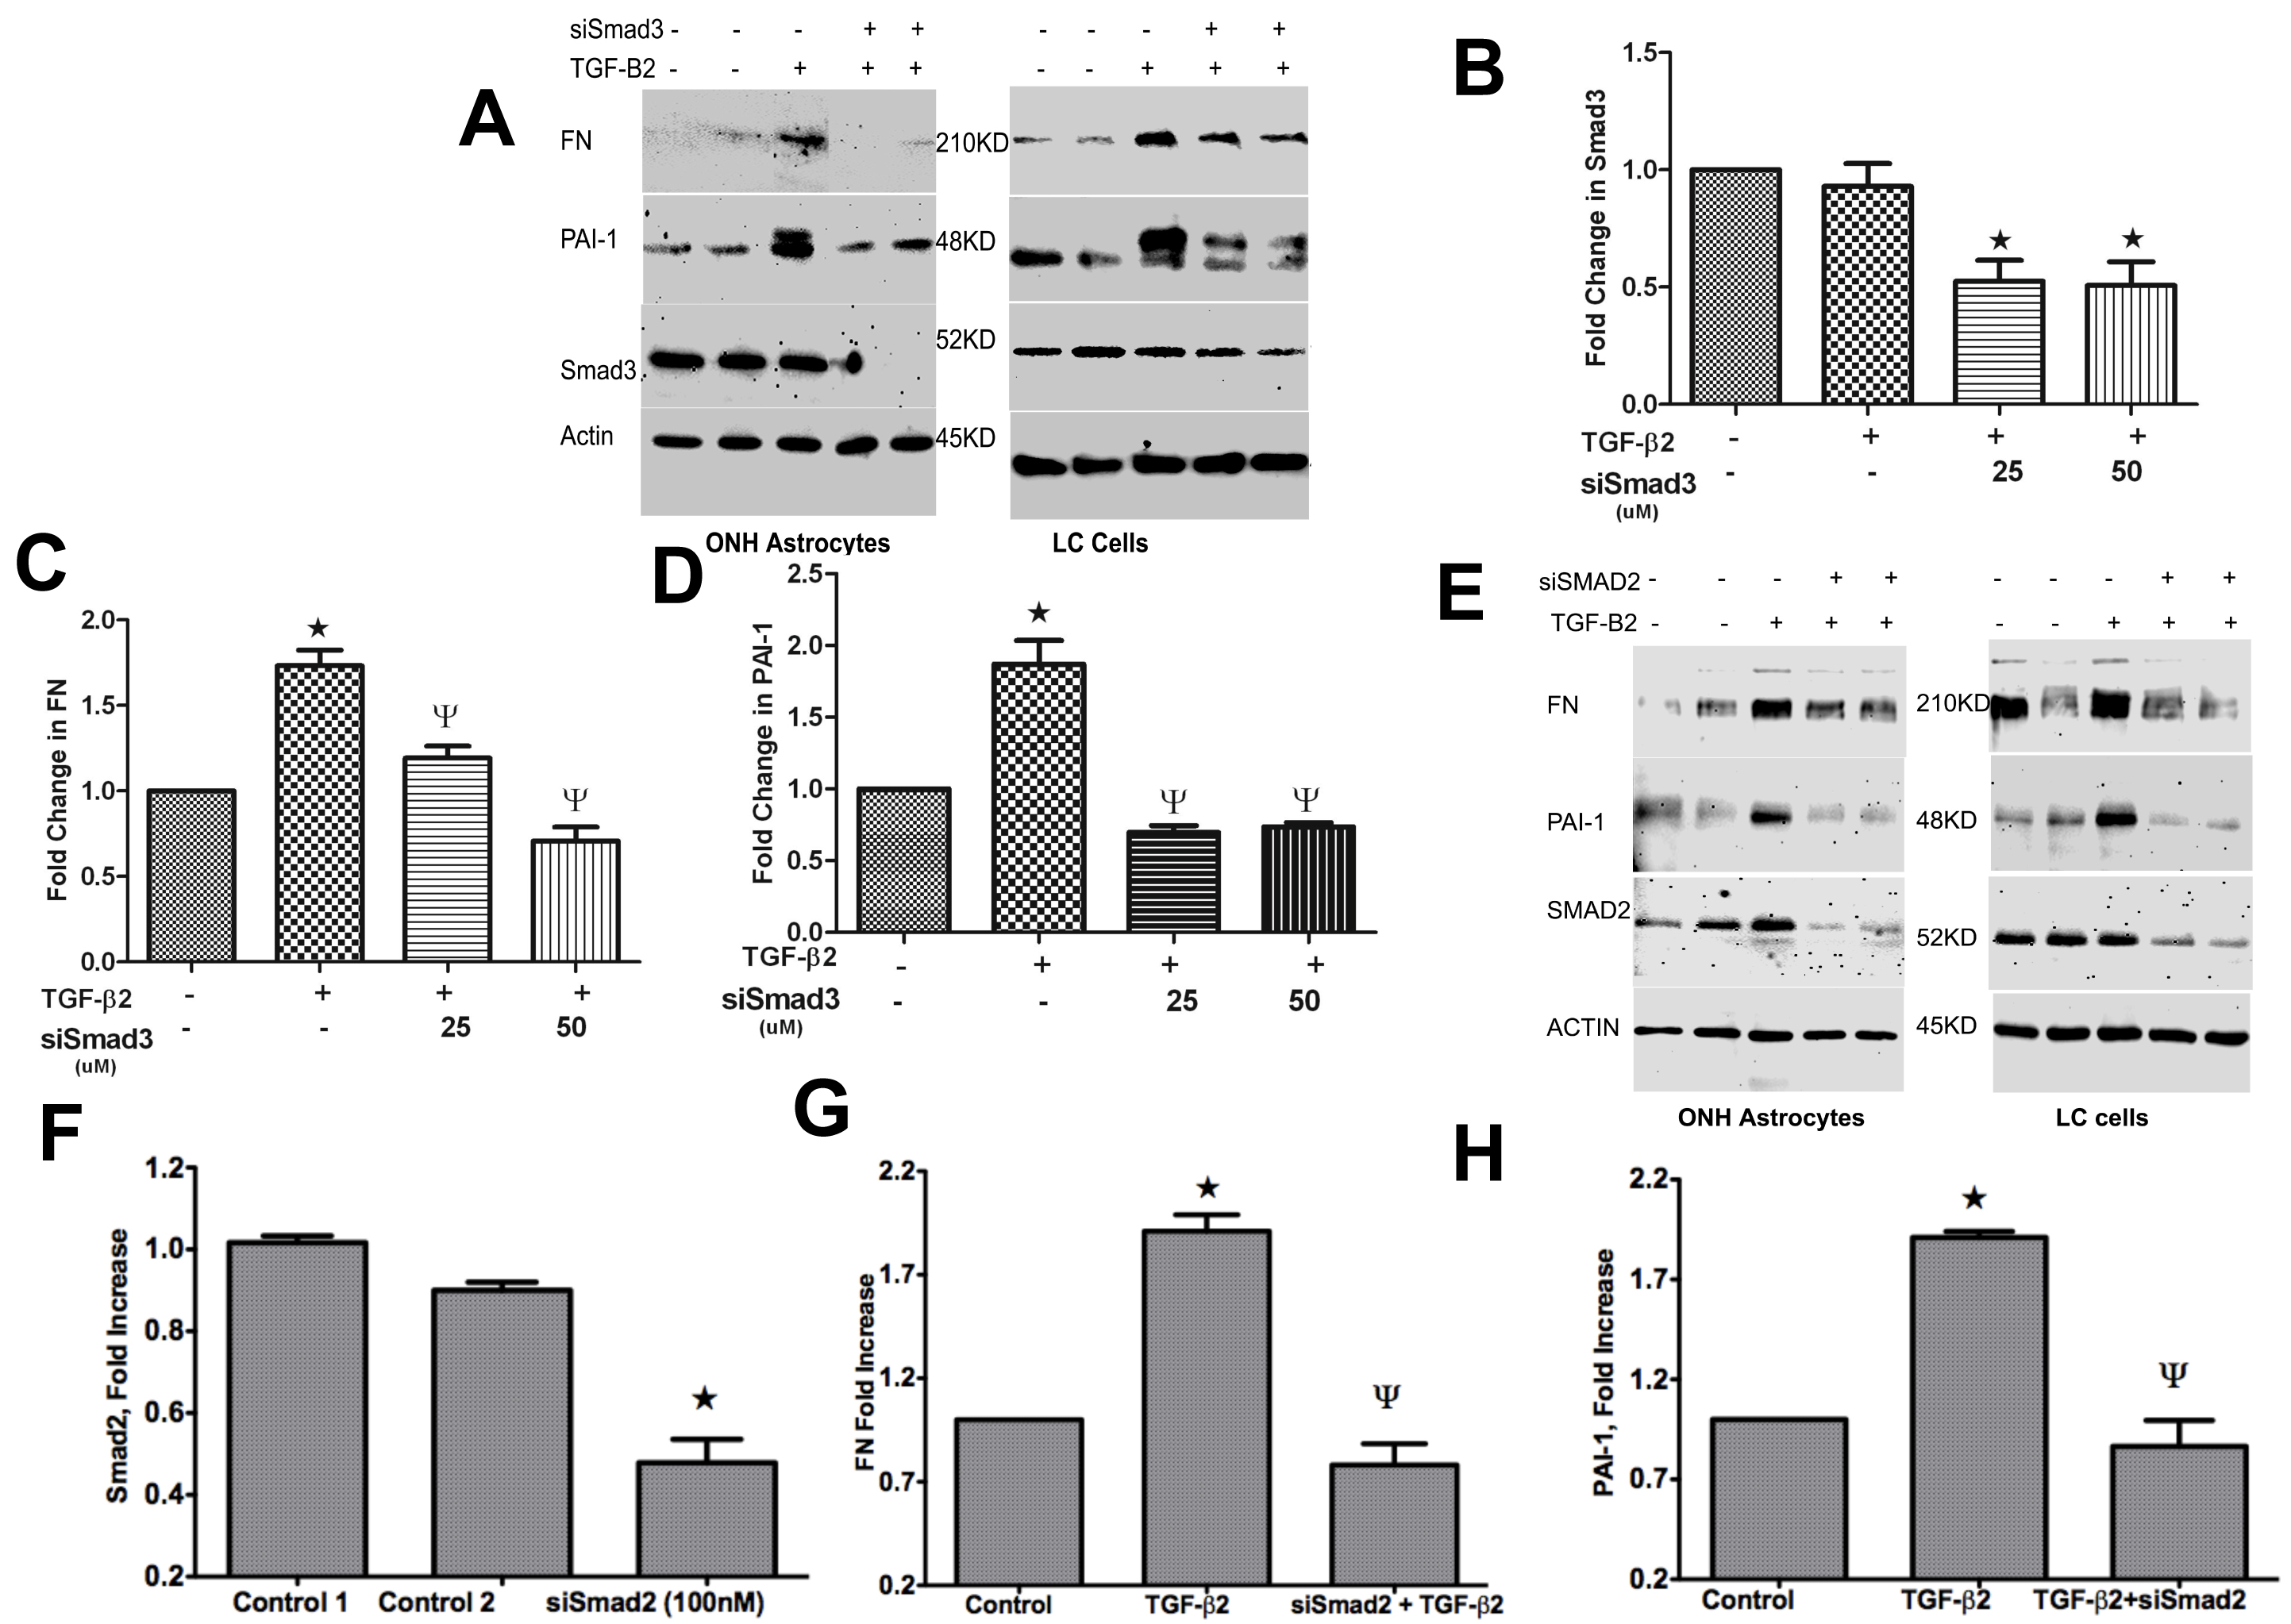
 Figure 8 of Zode, Mol Vis 2011; 17:1745-1758.