Figure 8. Topography of retinal ganglion
cell loss after light exposure. A and C: Photomontages
of a representative control retina showing retinal ganglion cells
(RGCs) identified by fluorogold (FG) tracing (A) or Brn3a
immunodetection (C). B and D: Corresponding
isodensity maps showing the spatial distribution of FG- or
Brn3a-positive RGCs. These maps are filled contour plots generated by
assigning a color code to each one of the subdivisions of each
individual frame according to its RGC density value within a
color-scale range that goes from 0 (purple) to 3,500 or higher (red)
RGCs/mm2. With both markers, it is observed that in control
retinas, RGCs are densest in the dorsal pole, along the nasotemporal
axis (A-D). E to L:
Isodensity maps obtained from
representative photoexposed retinas processed at increasing times ALE:
0 h (E), 1 month (F), 3 months (G), 6 months (H),
9
months
(I, J generated from the same retina where RGCs
were doubly identified by FG-tracing [I] and Brn3a detection [J]),
and
12
months (K, L generated from the same retina where
RGCs were doubly identified by FG-tracing (K) and Brn3a
detection (L)). RGC loss is observed at 6 months ALE (H),
as warm colors (red-oranges) are replaced by cooler ones
(yellow-green-blues). At 9 (I, J) and 12 months (K,
L) ALE, yellows and oranges have almost disappeared from the
maps, indicating that RGC loss has gone further; this is observed to
the same amount whether RGCs are identified by FG tracing (I, K)
or
Brn3a
expression (J, L). The wedge-shaped areas of
RGC loss have been marked with an X in K-L. The bottom of each
map shows the number of RGCs counted in the retina wherefrom the map
has been generated. The superior pole is at 12 o’clock. The scale bar
represents 1 mm.
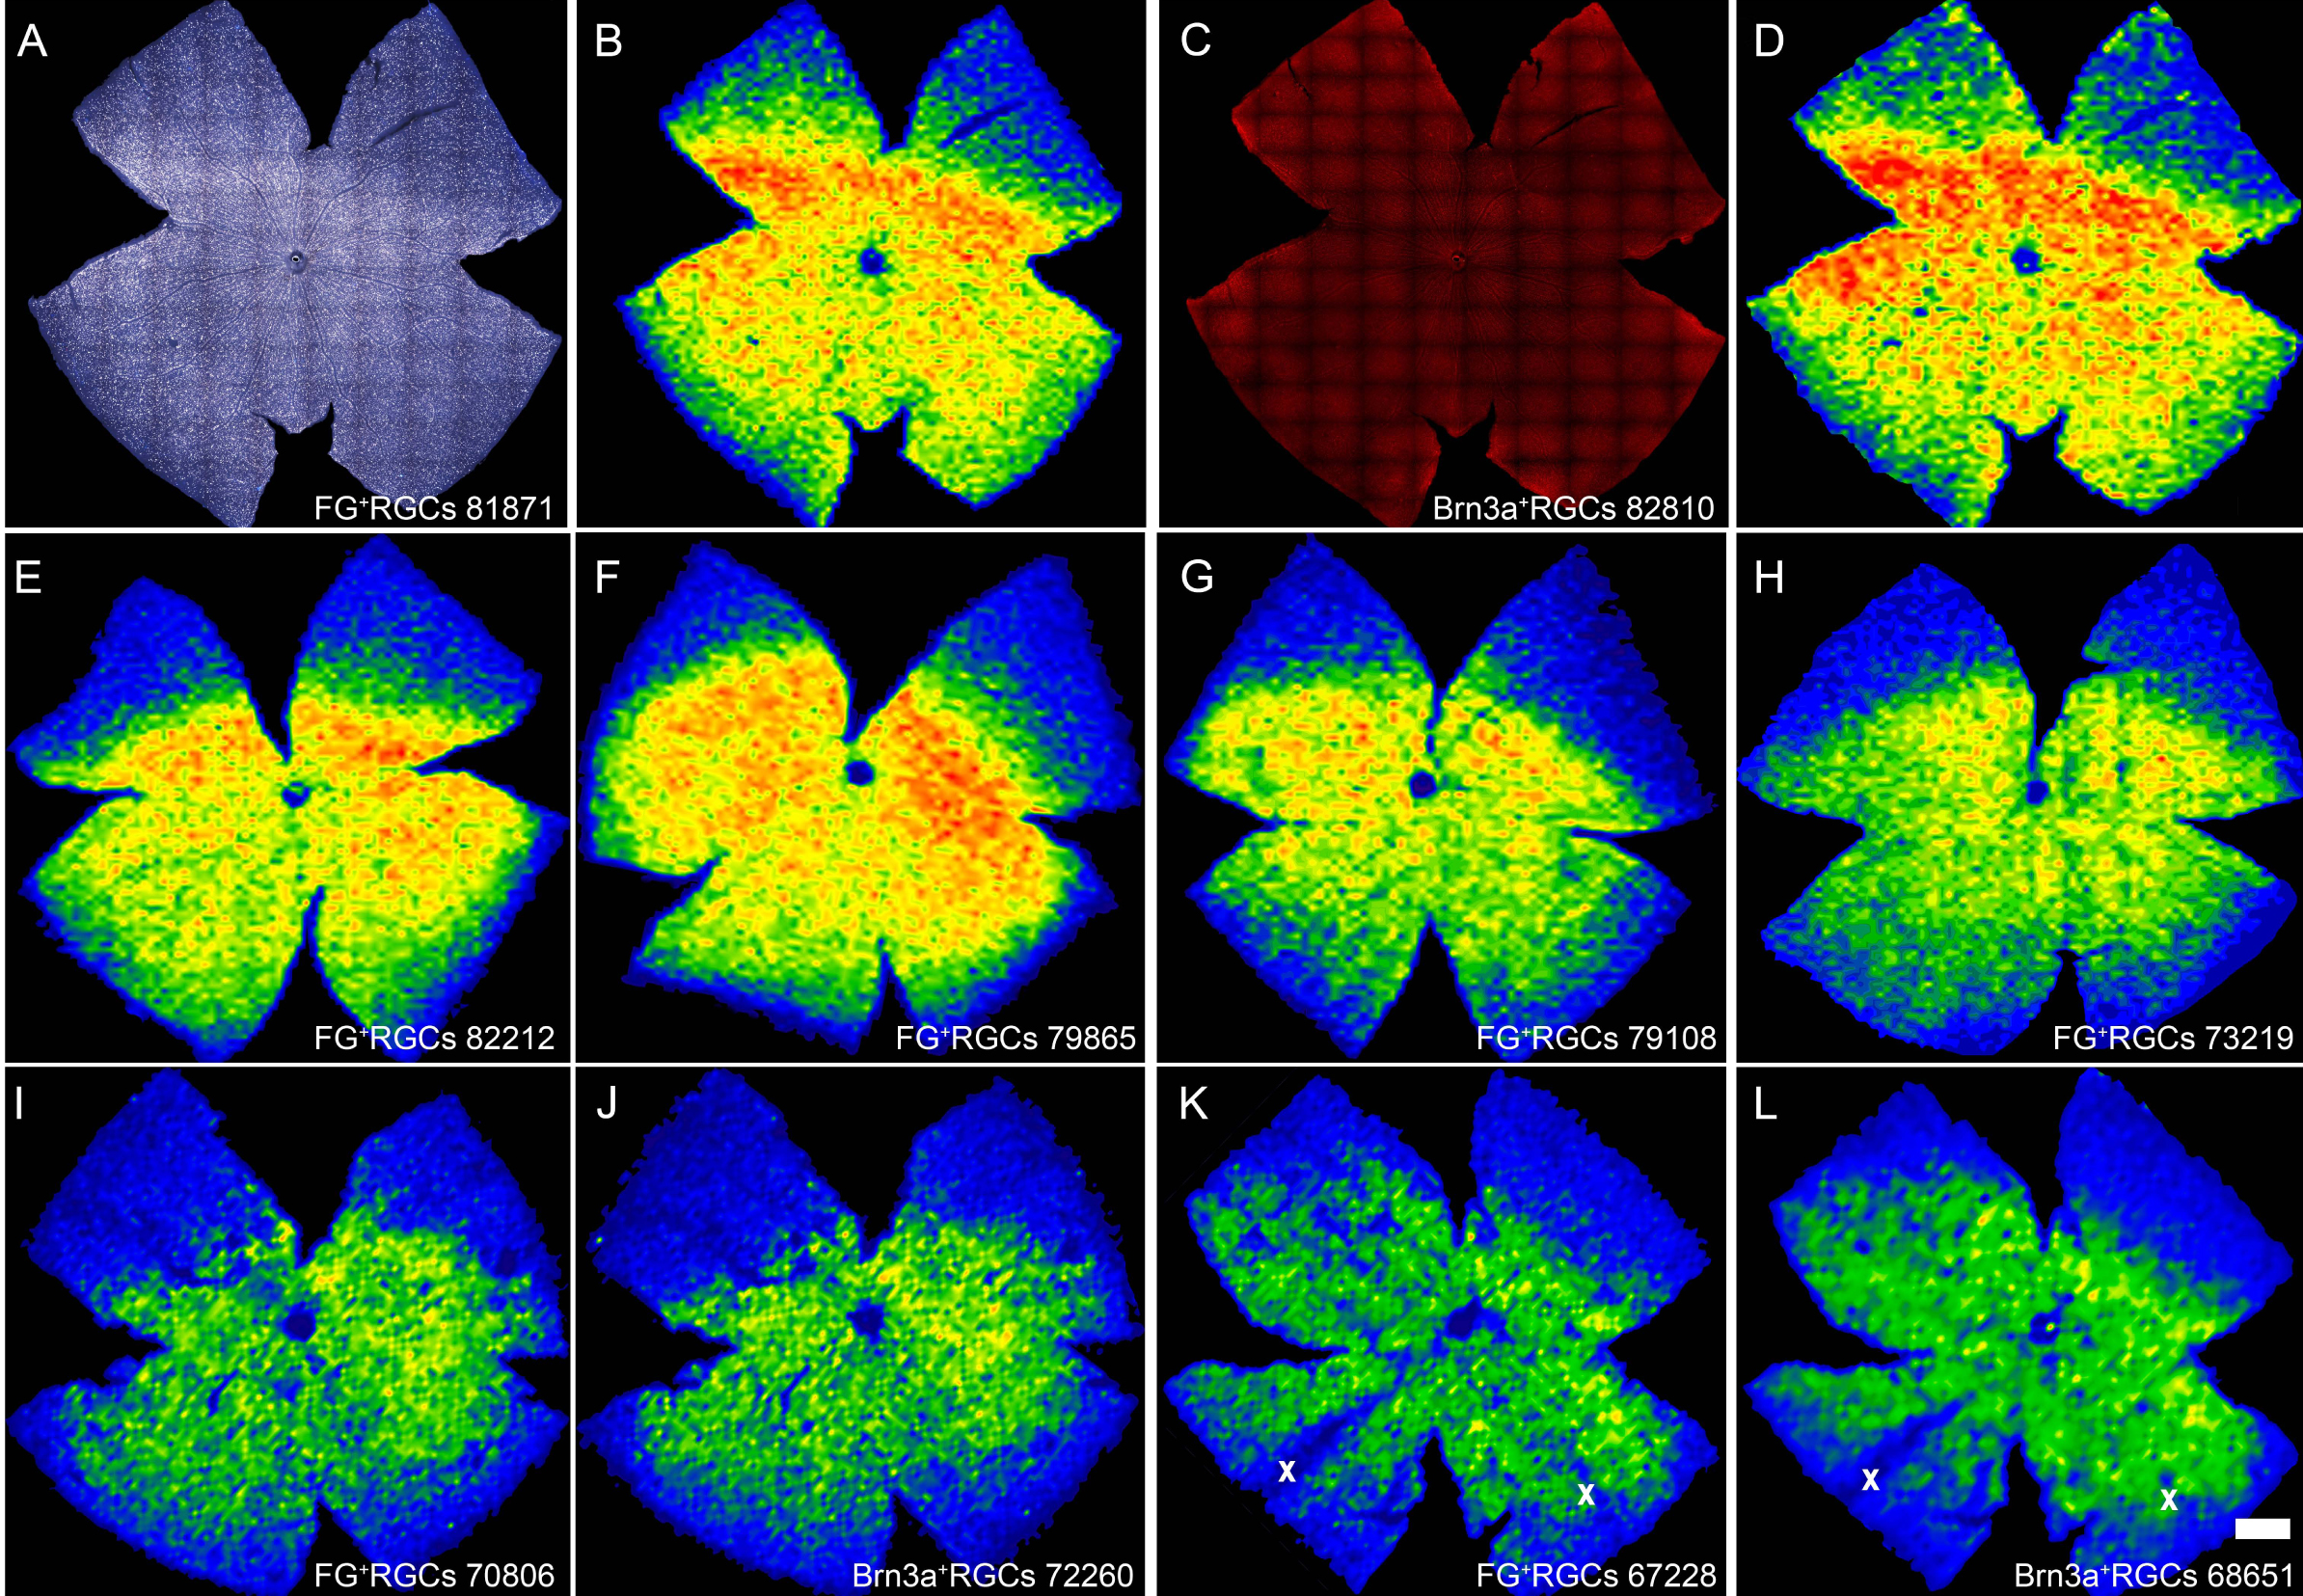
 Figure 8 of Garcia-Ayuso, Mol Vis 2011; 17:1716-1733.