Figure 7. Percentage of retinal ganglion cell loss after light exposure. A: Graph showing the percentage of surviving fluorogold (FG)-traced retinal ganglion cells (RGCs) at increasing times (h represents
hours, m represents months) after light exposure (ALE). The loss of RGCs is first significant 6 months ALE. B: Graph showing the percentage of surviving FG- or Brn3a-positive RGCs 9 and 12 months ALE. With both markers, it is observed
that at these time points, there is a significant diminution of the RGC population. In both graphs, the percentage of labeled
cells in control animals (100%; P60+P365) represents the mean number of labeled cells in young (P60) and old (P365) animals.
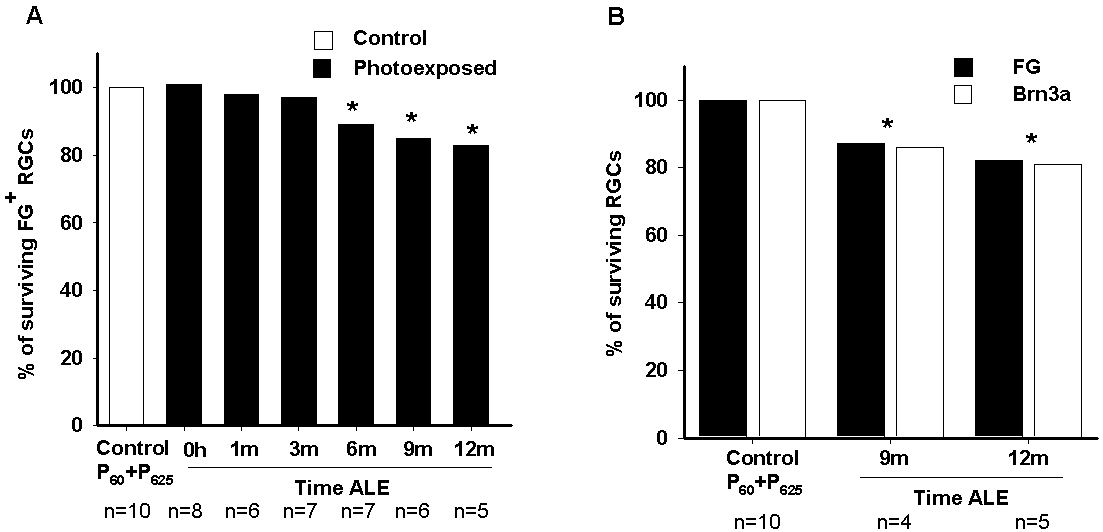
 Figure 7 of
Garcia-Ayuso, Mol Vis 2011; 17:1716-1733.
Figure 7 of
Garcia-Ayuso, Mol Vis 2011; 17:1716-1733.