Figure 3. Temporal and spatial course of
photoreceptor loss after light exposure. Hematoxylin and eosin–stained
retinal cross-sections of control retinas (lower row) and of the left
(dilated) eyes from animals photoexposed under circular (left two
columns) or linear (right two columns) bulbs. Images were taken from
the mid-dorsal and midventral retina. A-D: animals processed at
0 h, E-H: 7 days, I-L: 1 month, M-P: 3 months, Q:
6
months, R, S: 9 months, T: 12 months after
light exposure (ALE) and control animals. U-V represents
control animals. Photoreceptor loss is observed in all sections but in D
(animals processed 0 h ALE; ventral retina), where the retinal
structure is conserved and is similar to control animals. Photoreceptor
loss was always more severe in the dorsal retina. During the first 3
months ALE, retinal damage was more drastic in the animals exposed to
circular bulbs; however, from this time point onwards, it was similar
in all animals (M-P). Six or more months ALE (Q-T),
vascular
complexes (arrowheads) were observed in the subretinal space,
sometimes connected to vessels that ran vertically in the retina and
that are surrounded by nonpigmented cells (arrows). The scale bar
represents 100 µm.
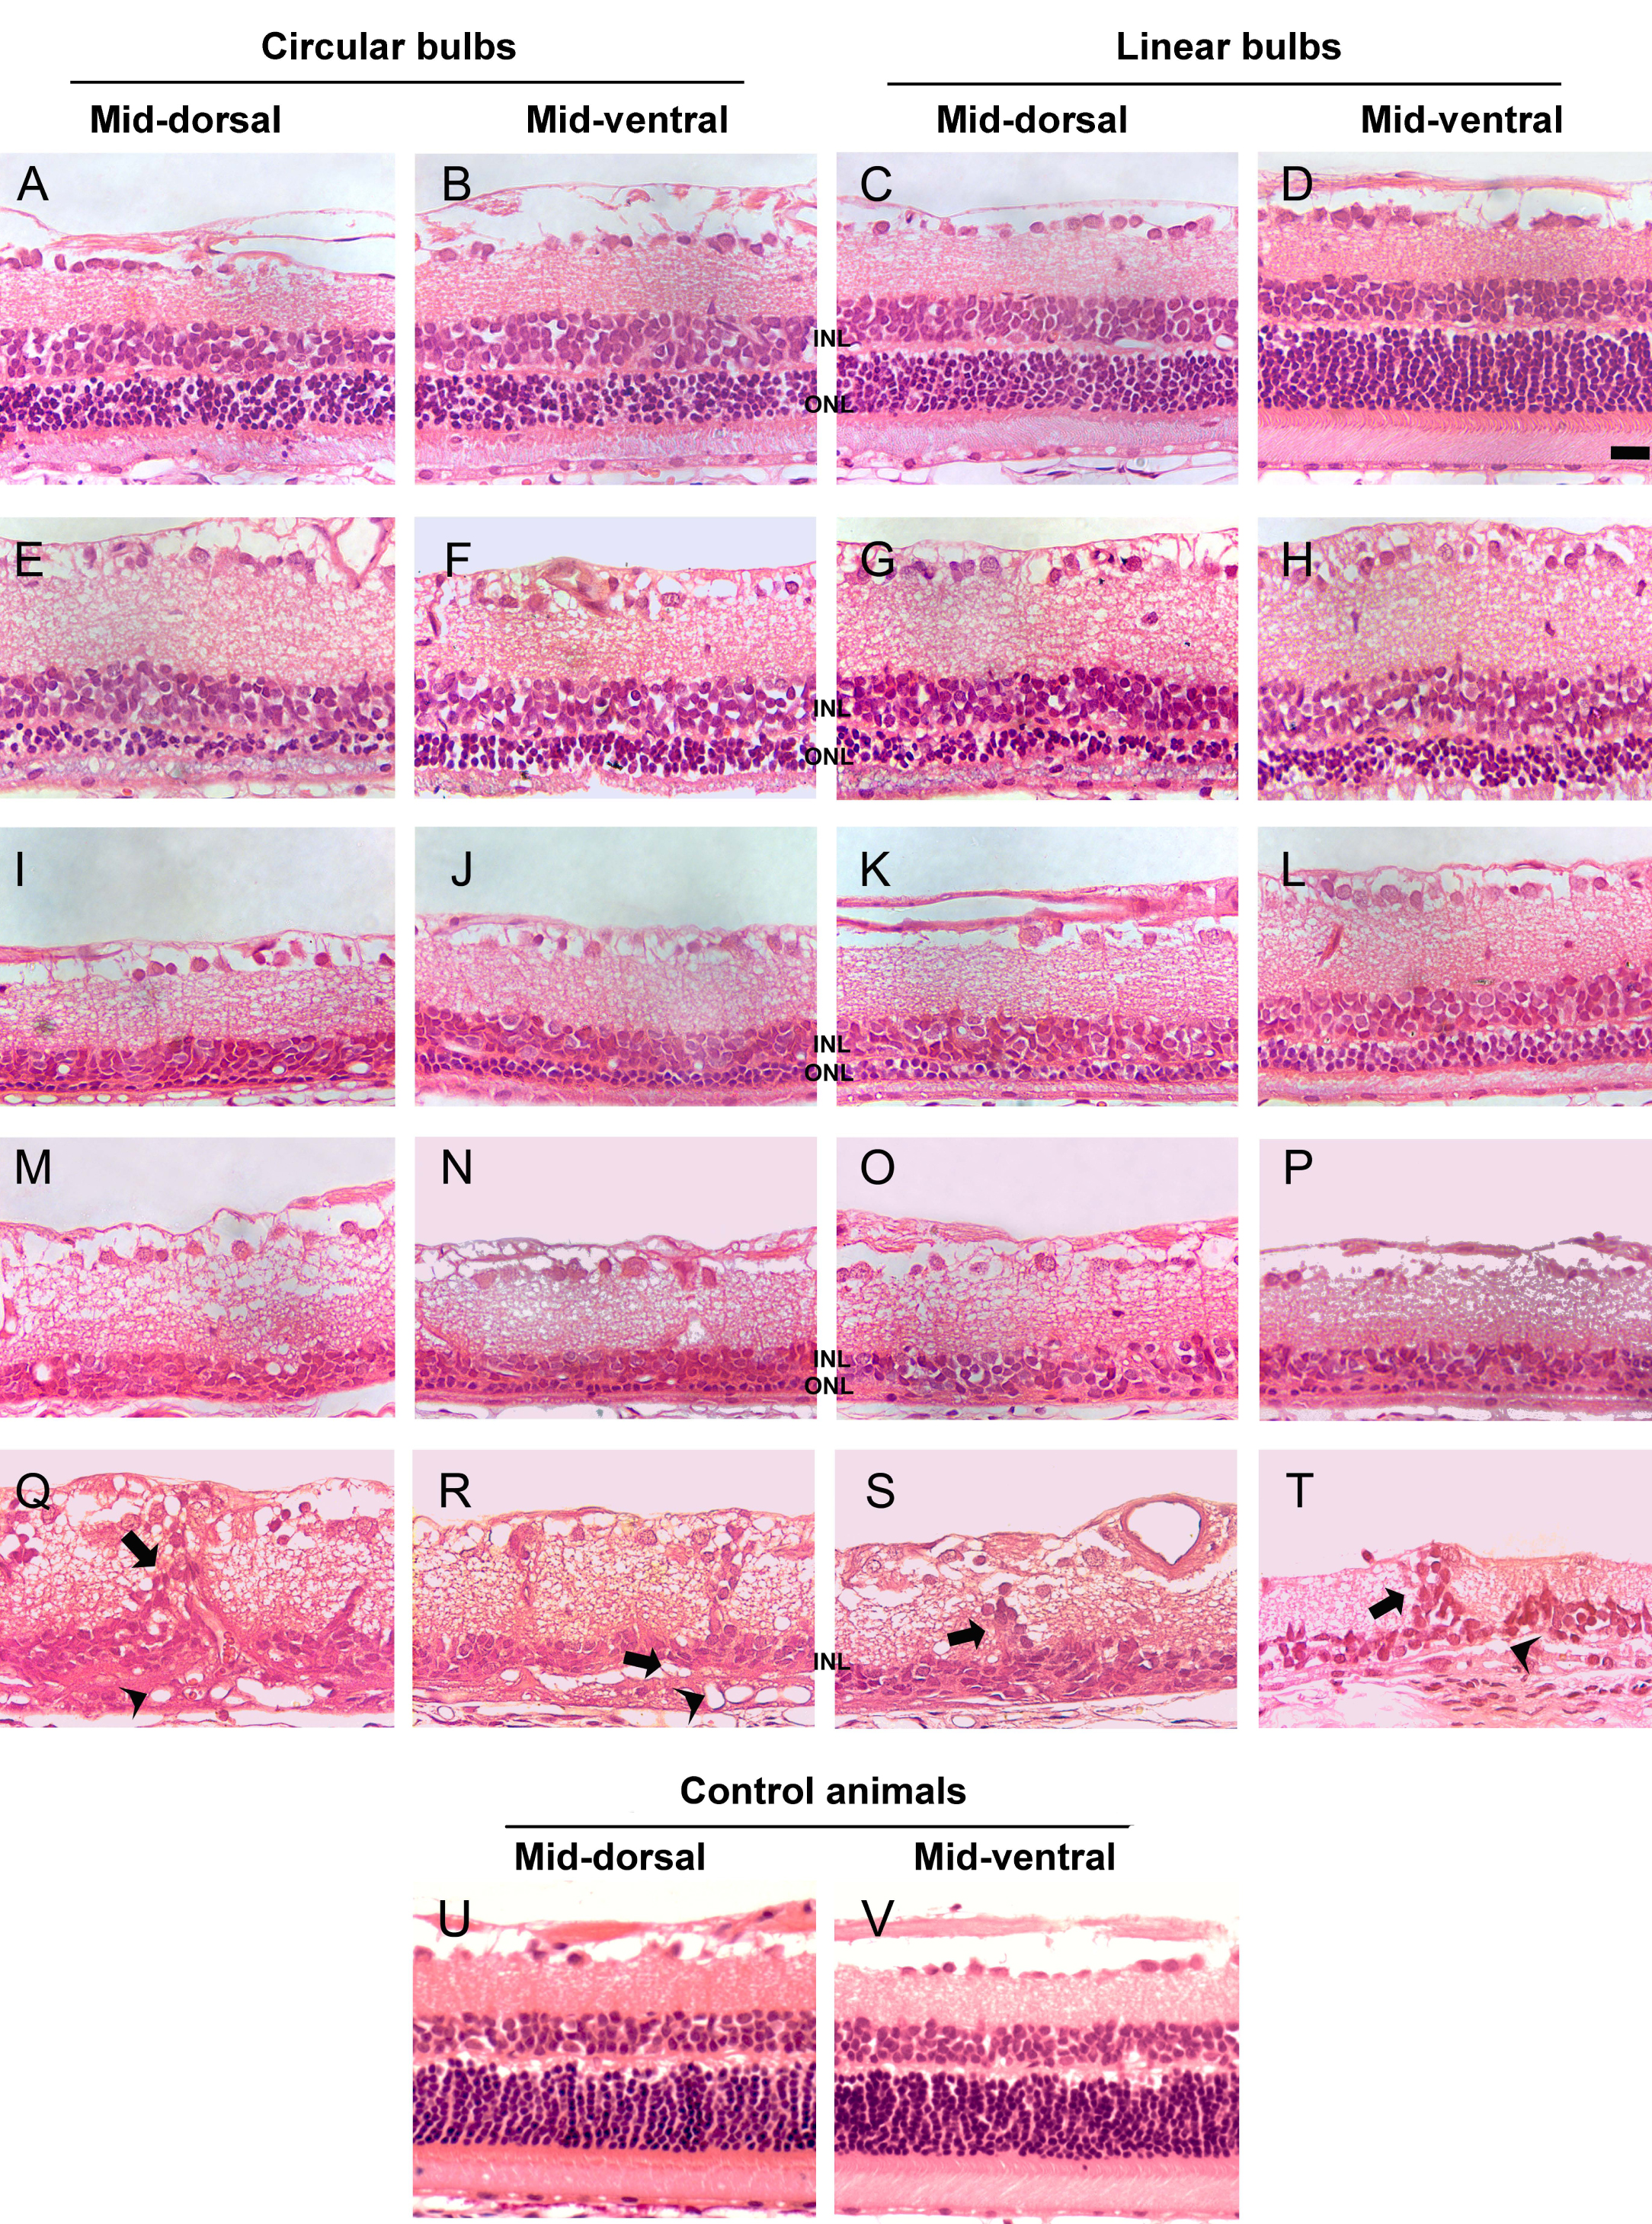
 Figure 3 of Garcia-Ayuso, Mol Vis 2011; 17:1716-1733.