Figure 3 of
Zheng, Mol Vis 2011; 17:1694-1700.
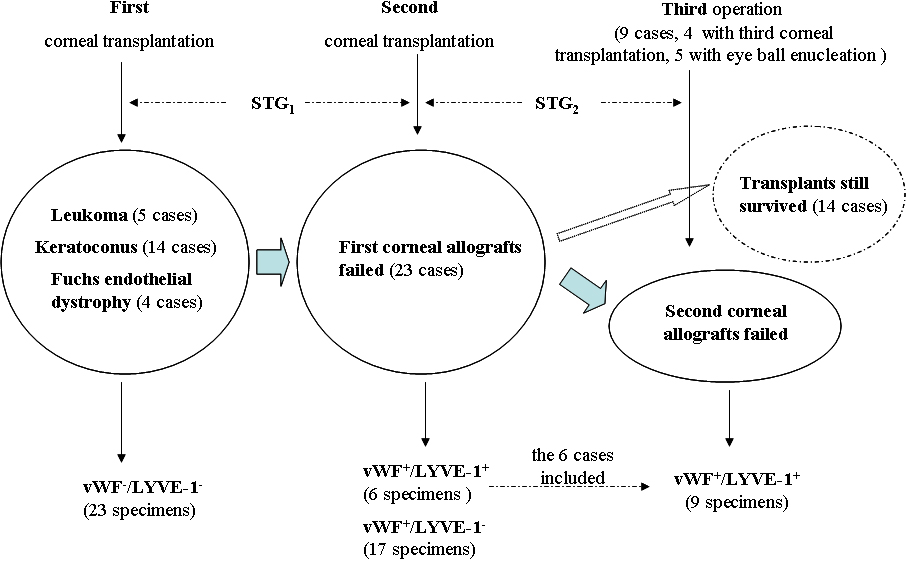
Figure 3.
Schematic diagram of survival time of grafts (STG), hemangiogenesis and lymphangiogenesis detected at different times following corneal transplantation.
 Figure 3 of
Zheng, Mol Vis 2011; 17:1694-1700.
Figure 3 of
Zheng, Mol Vis 2011; 17:1694-1700.