Figure 3. Specificity of K12, K13, and K19 expression in human cornea. A: Percentage of K12+, K13+ and K12+/K13+ cells in the central (left) and peripheral cornea (middle). The average percentages of the three cell populations are obtained
(right). B: Percentage of K12+, K19+ and K12+/K19+ cells in the central (left) and peripheral cornea (middle). The average percentages of the three cell populations are obtained
(right). The asterisk indicates a p<0.05 between K12+ and K19+ or K13+ cells, the double asterisk indicates a p<0.05 between K12+ and K12+/19+ or K12+/K13+ cells.
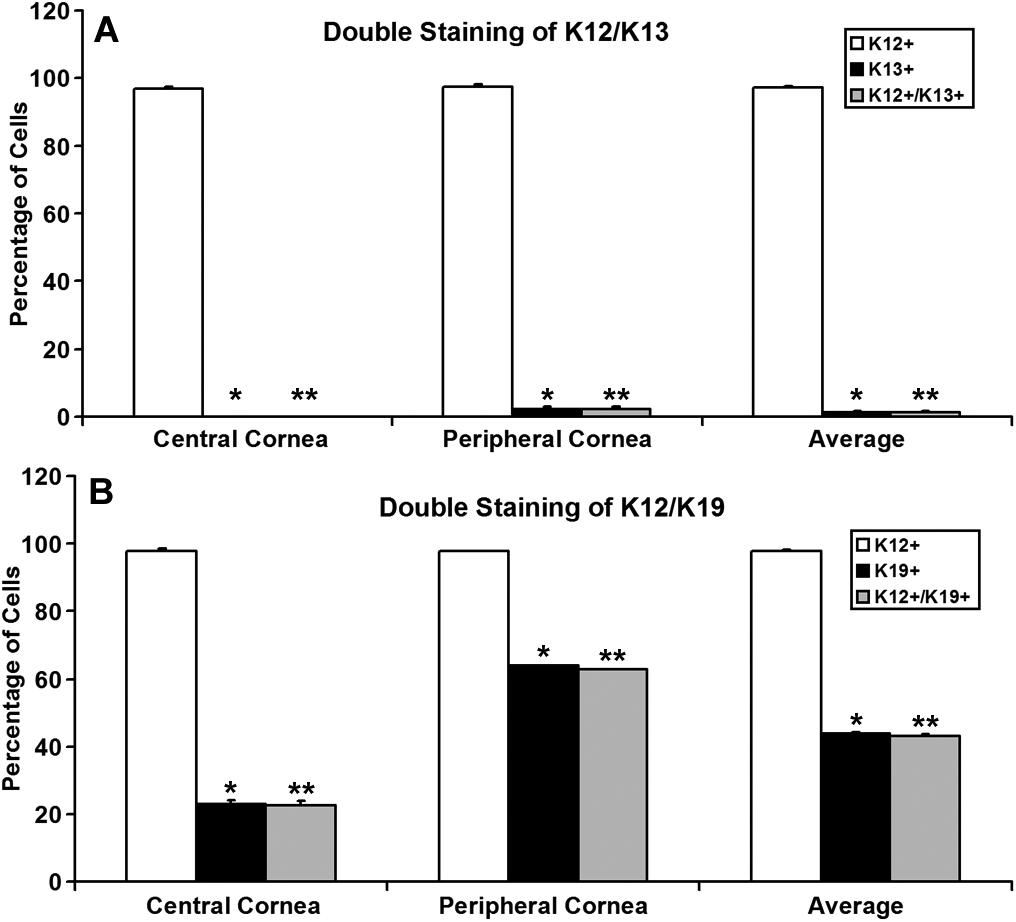
 Figure 3 of
Ramirez-Miranda, Mol Vis 2011; 17:1652-1661.
Figure 3 of
Ramirez-Miranda, Mol Vis 2011; 17:1652-1661.