Figure 3. Nonparametric LOD score plot for chromosome 11. LOD scores for the overall sample (n=63 [dashed line]) and the subset with
maximum NPL score between 12.2 and −0.3 (n=45 [solid line]) are presented. The 1-LOD-unit down support interval (42–90 cM)
is marked by the dotted vertical line.
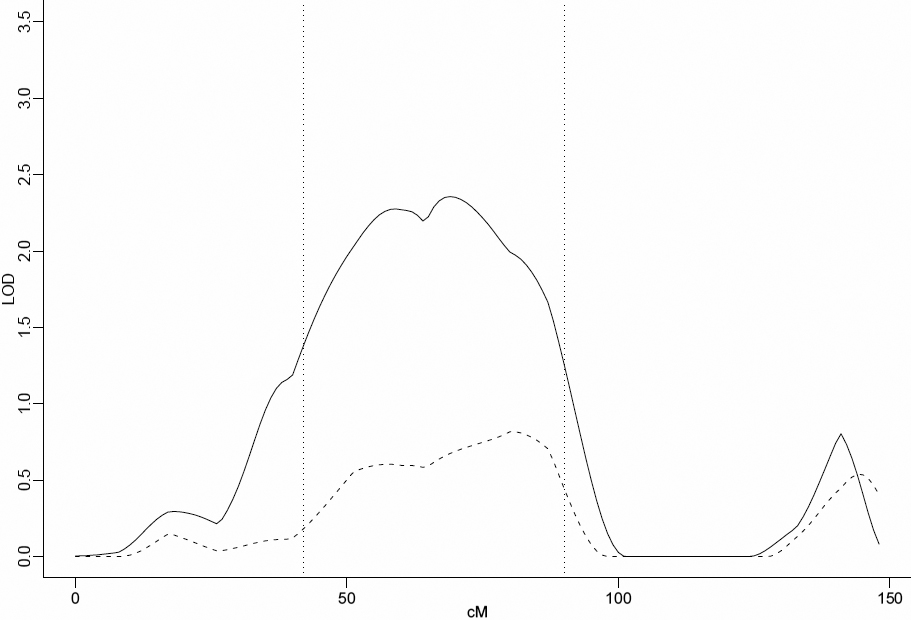
 Figure 3 of
Simpson, Mol Vis 2011; 17:1641-1651.
Figure 3 of
Simpson, Mol Vis 2011; 17:1641-1651.