Figure 4. Hydropathy analysis of the mutant protein. Kyte-Doolittle hydropathy plot of CRYBB2WT (A) and CRYBB2A2V (B). The x-axis represents position of amino acids. The y-axis represents the hydropathy value in a default window size of 7.
The region of interest is marked by white boxes. The increase in hydrophobicity in the mutant form is evident.
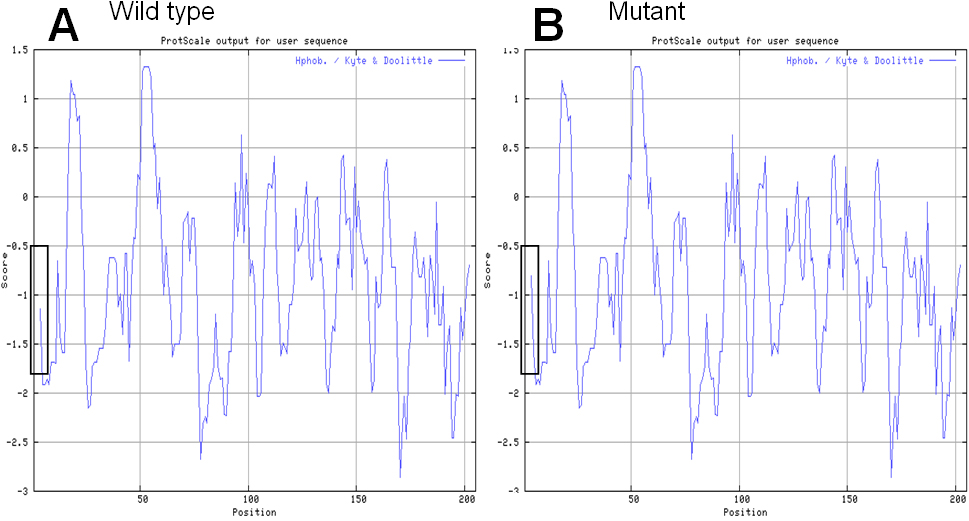
 Figure 4 of
Yao, Mol Vis 2011; 17:144-152.
Figure 4 of
Yao, Mol Vis 2011; 17:144-152.