Figure 8. The effect of inflammatory
cytokine on complement C3 and C5 gene expression in
BV-2 and retinal pigment epithelium cells. Primary RPE cells and BV-2
cells were treated with pro-inflammatory cytokines tumor necrosis
factor (TNF)-α (20 ng/ml), interferon (IFN)-γ (100 ng/ml), interleukin
(IL)-6 (10 ng/ml), and lipopolysaccharides (LPS;1 µg/ml) for 20 h.
Cells were then collected for real-time RT–PCR analysis of C3
gene expression (A) or conventional RT–PCR analysis of C5
gene expression (B). Mouse liver RNA was used as a positive
control in B. n=3 in each group. *p<0.05; **p<0.01 when
compared to untreated controls using unpaired Student's t test.
Experiments were repeated twice.
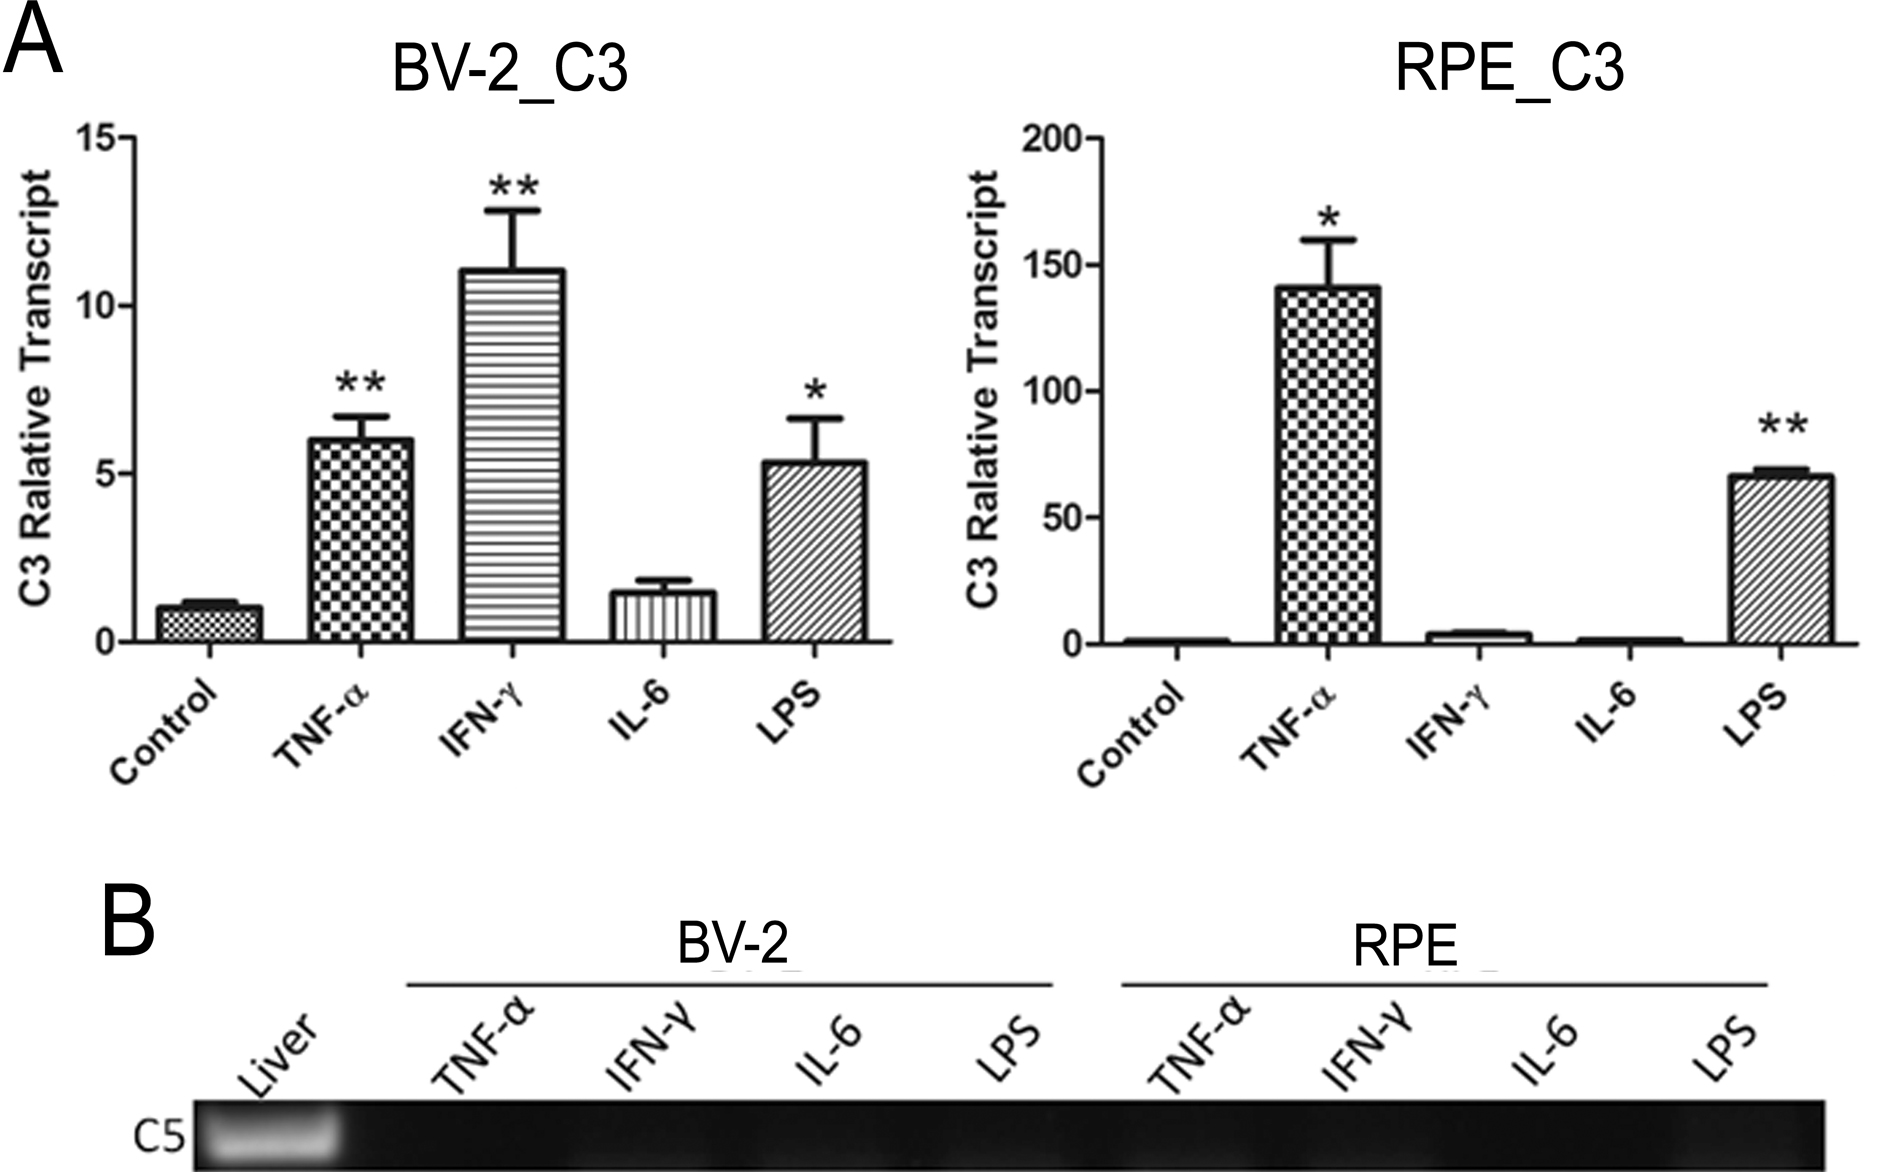
 Figure 8 of Luo, Mol Vis 2011; 17:1588-1597.