Figure 5. Quantification of VEGF protein
in ROP model at different postnatal day ages. ELISA measurements of
retinal VEGF protein from postnatal days (P) 0 through P18 in RA or the
ROP model. Increased VEGF associated with older developmental age
(ANOVA, p<0.0001) or the ROP model compared to RA samples (ANOVA,
p<0.0001). Post-hoc testing revealed increased VEGF protein in the
ROP model compared to RA at P8, P12, P14, and P18 (p=0.0002,
p<.0001, p<0.0001, p=0.0117). In the ROP model, VEGF was
significantly greater following hypoxic compared to hyperoxic cycles
(P12 versus P11 [p=0.0014], P12 versus P13, and P14 versus P13;
p<0.0001, each). Error bars represent standard errors. Each
postnatal day age had at least five retinas from different pups taken
from at least two different litters.
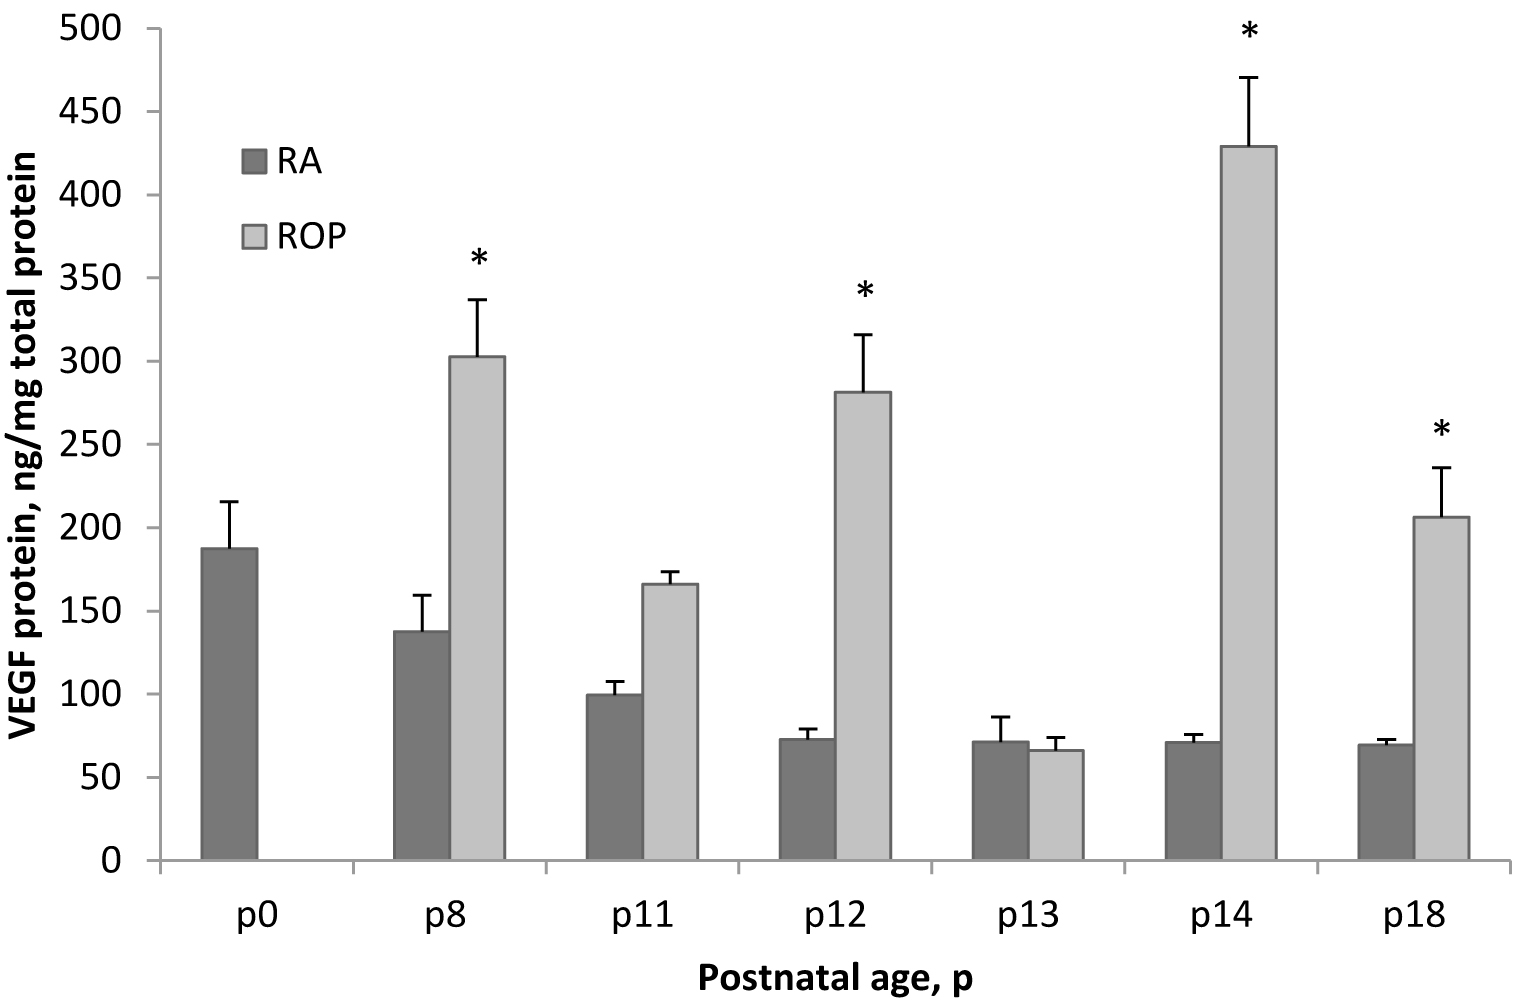
 Figure 5 of Hartmann, Mol Vis 2011; 17:1577-1587.