Figure 4. Quantification of PEDF protein
in ROP model at different postnatal day ages. ELISA measurements of
retinal PEDF protein from selected postnatal days (P) 0 through P18 in
RA or in the ROP model. Increased PEDF associated with older
developmental age (p=0.005) or the ROP model compared to RA samples
(ANOVA, p<0.0001). *Post-hoc testing revealed increased PEDF in the
ROP model compared to RA at P11 and P13 (p=0.0041, p=0.0022
respectively). Error bars represent standard errors. Each time point
had at least five retinas from different pups taken from at least two
different litters.
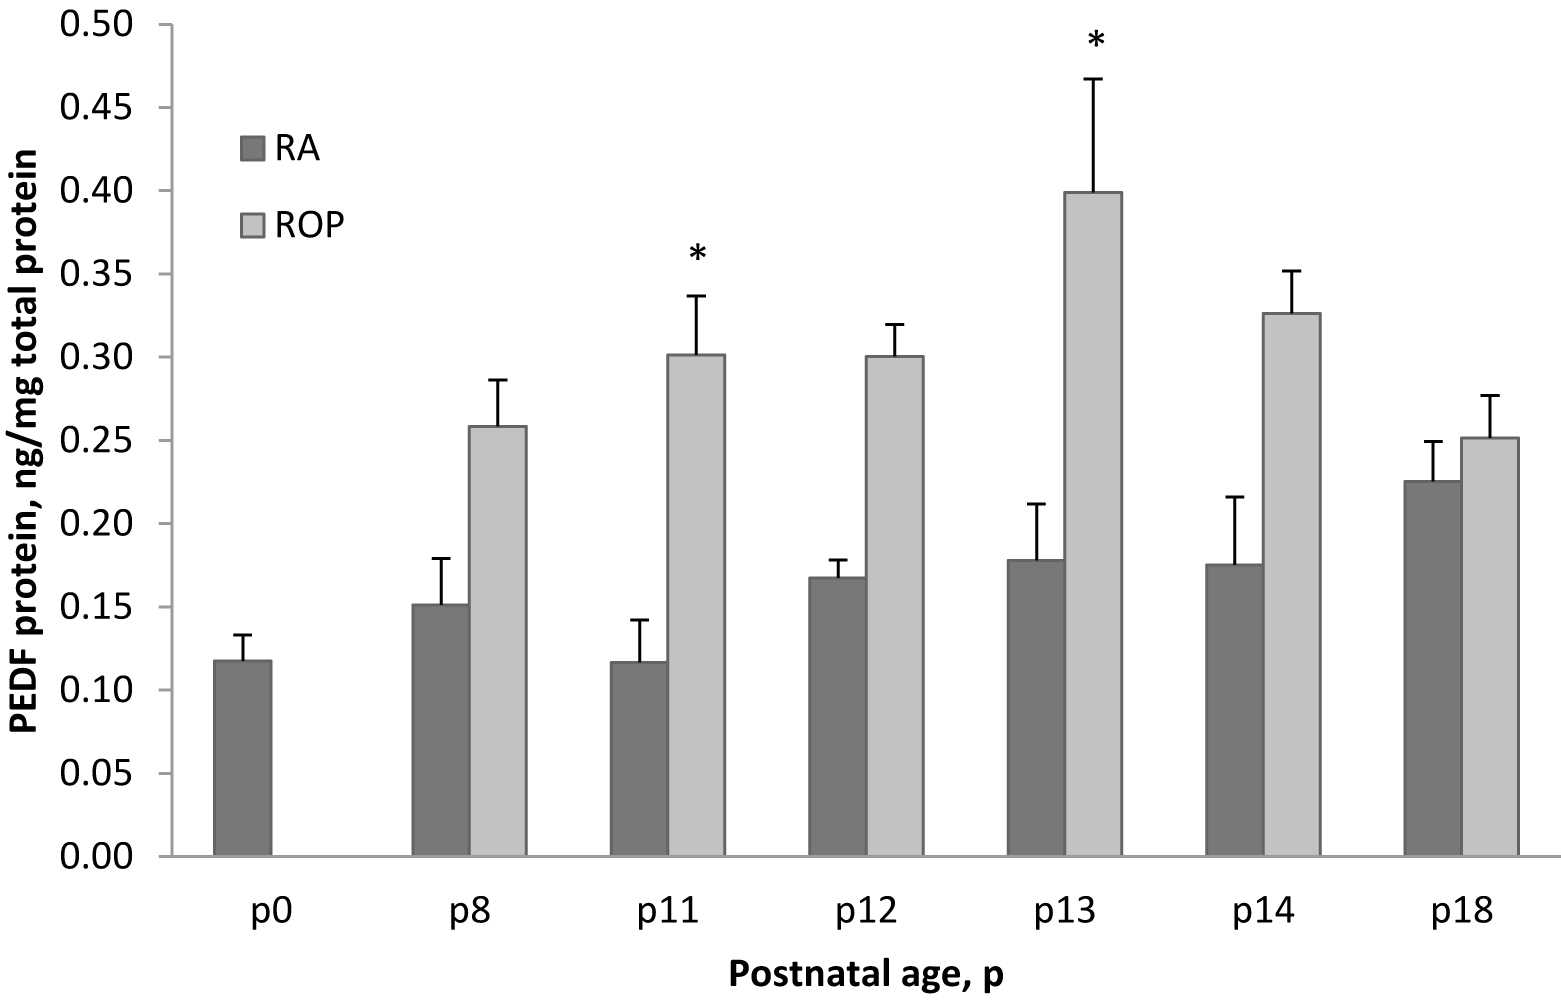
 Figure 4 of Hartmann, Mol Vis 2011; 17:1577-1587.