Figure 7. Depletion of protein kinase C
(PKCα) and PKCδ by shRNA. RPE50 cells were transfected with none
(MOCK), or various shRNAs fragments (either alone or in combination) of
indicated PKC isozymes. Western blots of PKCα (upper panel), PKCδ
(middle panel), or PKCβII (lower panel) were performed using
non-specific bands in the Ponceau S stained blots as internal controls.
The relative ratios of the band intensity of each PKC versus a
nonspecific band, taking the ratio of MOCK as 1.0, are shown below. The
results were the average of three repeated experiments with a C.V. of
6.0–8.0.
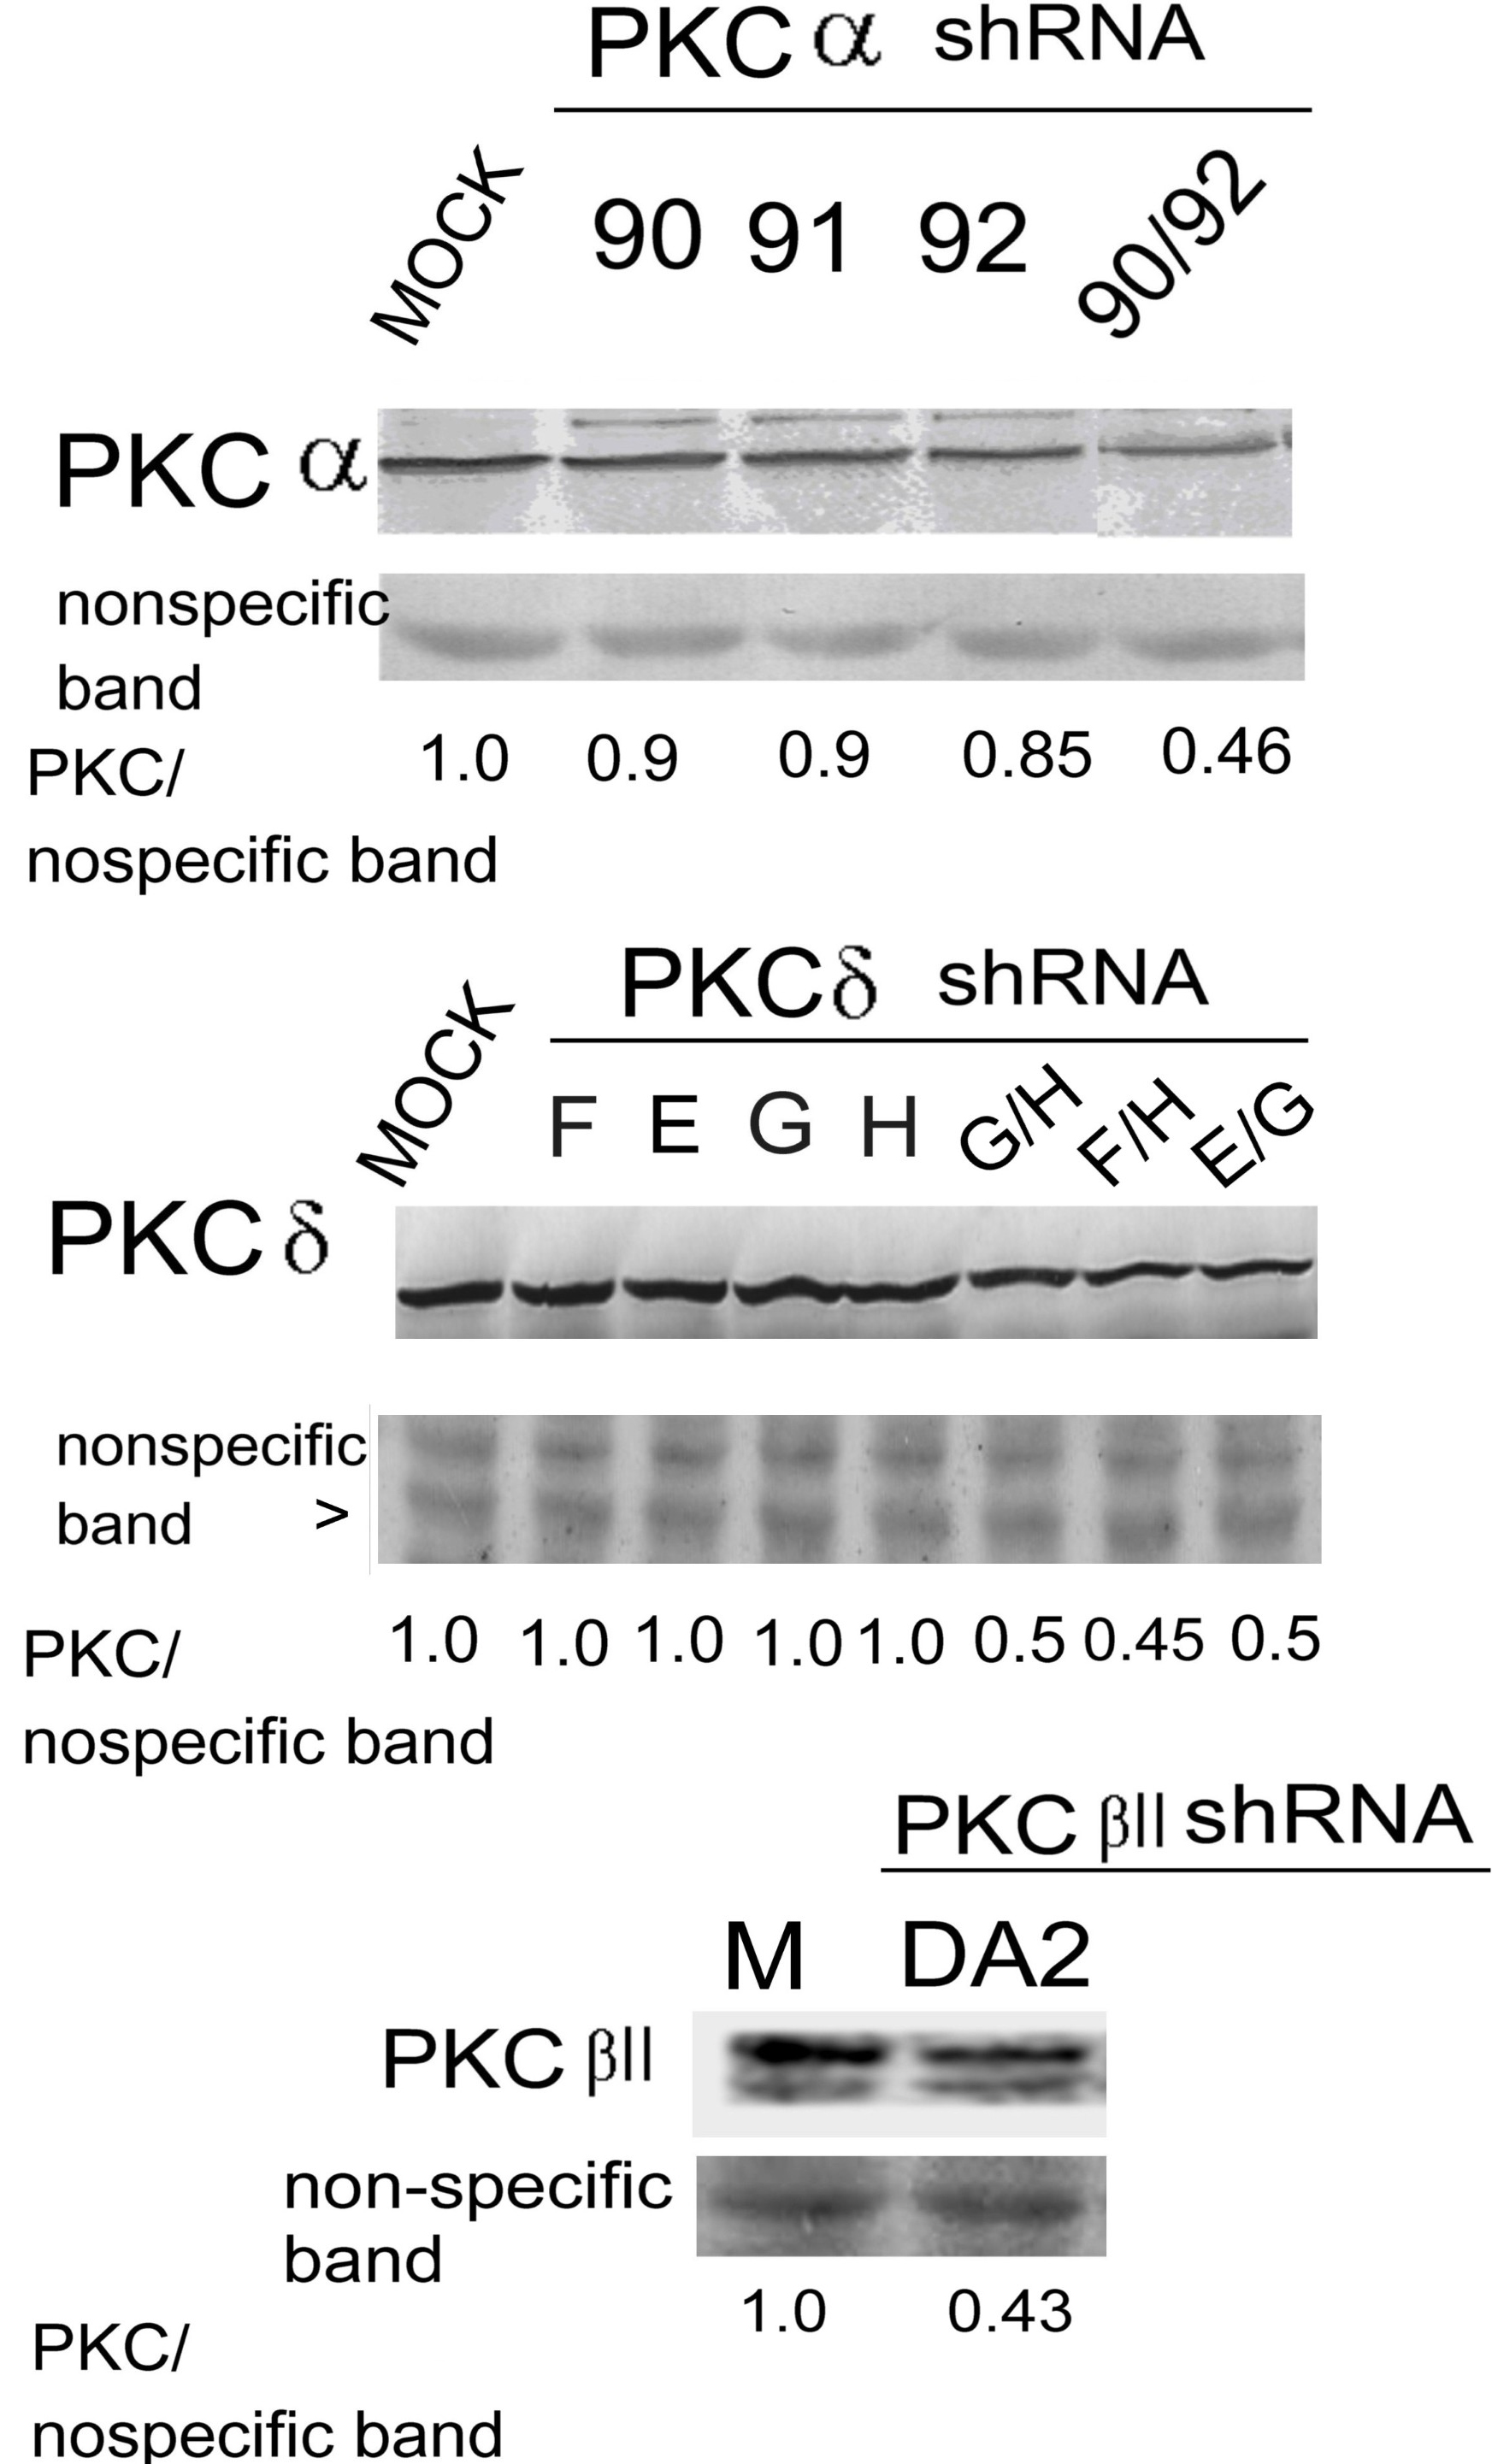
 Figure 7 of Tsai, Mol Vis 2011; 17:1564-1576.