Figure 6. Extended time-course analysis of
ethambutol (EMB)-induced elevation of membrane protein kinase C (PKCδ).
RPE50 cells were treated with 8.0 mM EMB for 0, 1, 3, 6, and 24 h. A
western blot of membrane PKC δ was performed. A non-specific band in
the Ponceau S stained blot was included as an internal control. The
result is representative of two repeated experiments. The relative
ratios of the band intensity of PKC δ versus a non-specific band,
taking the ratio of time zero as 1.0, are shown below.
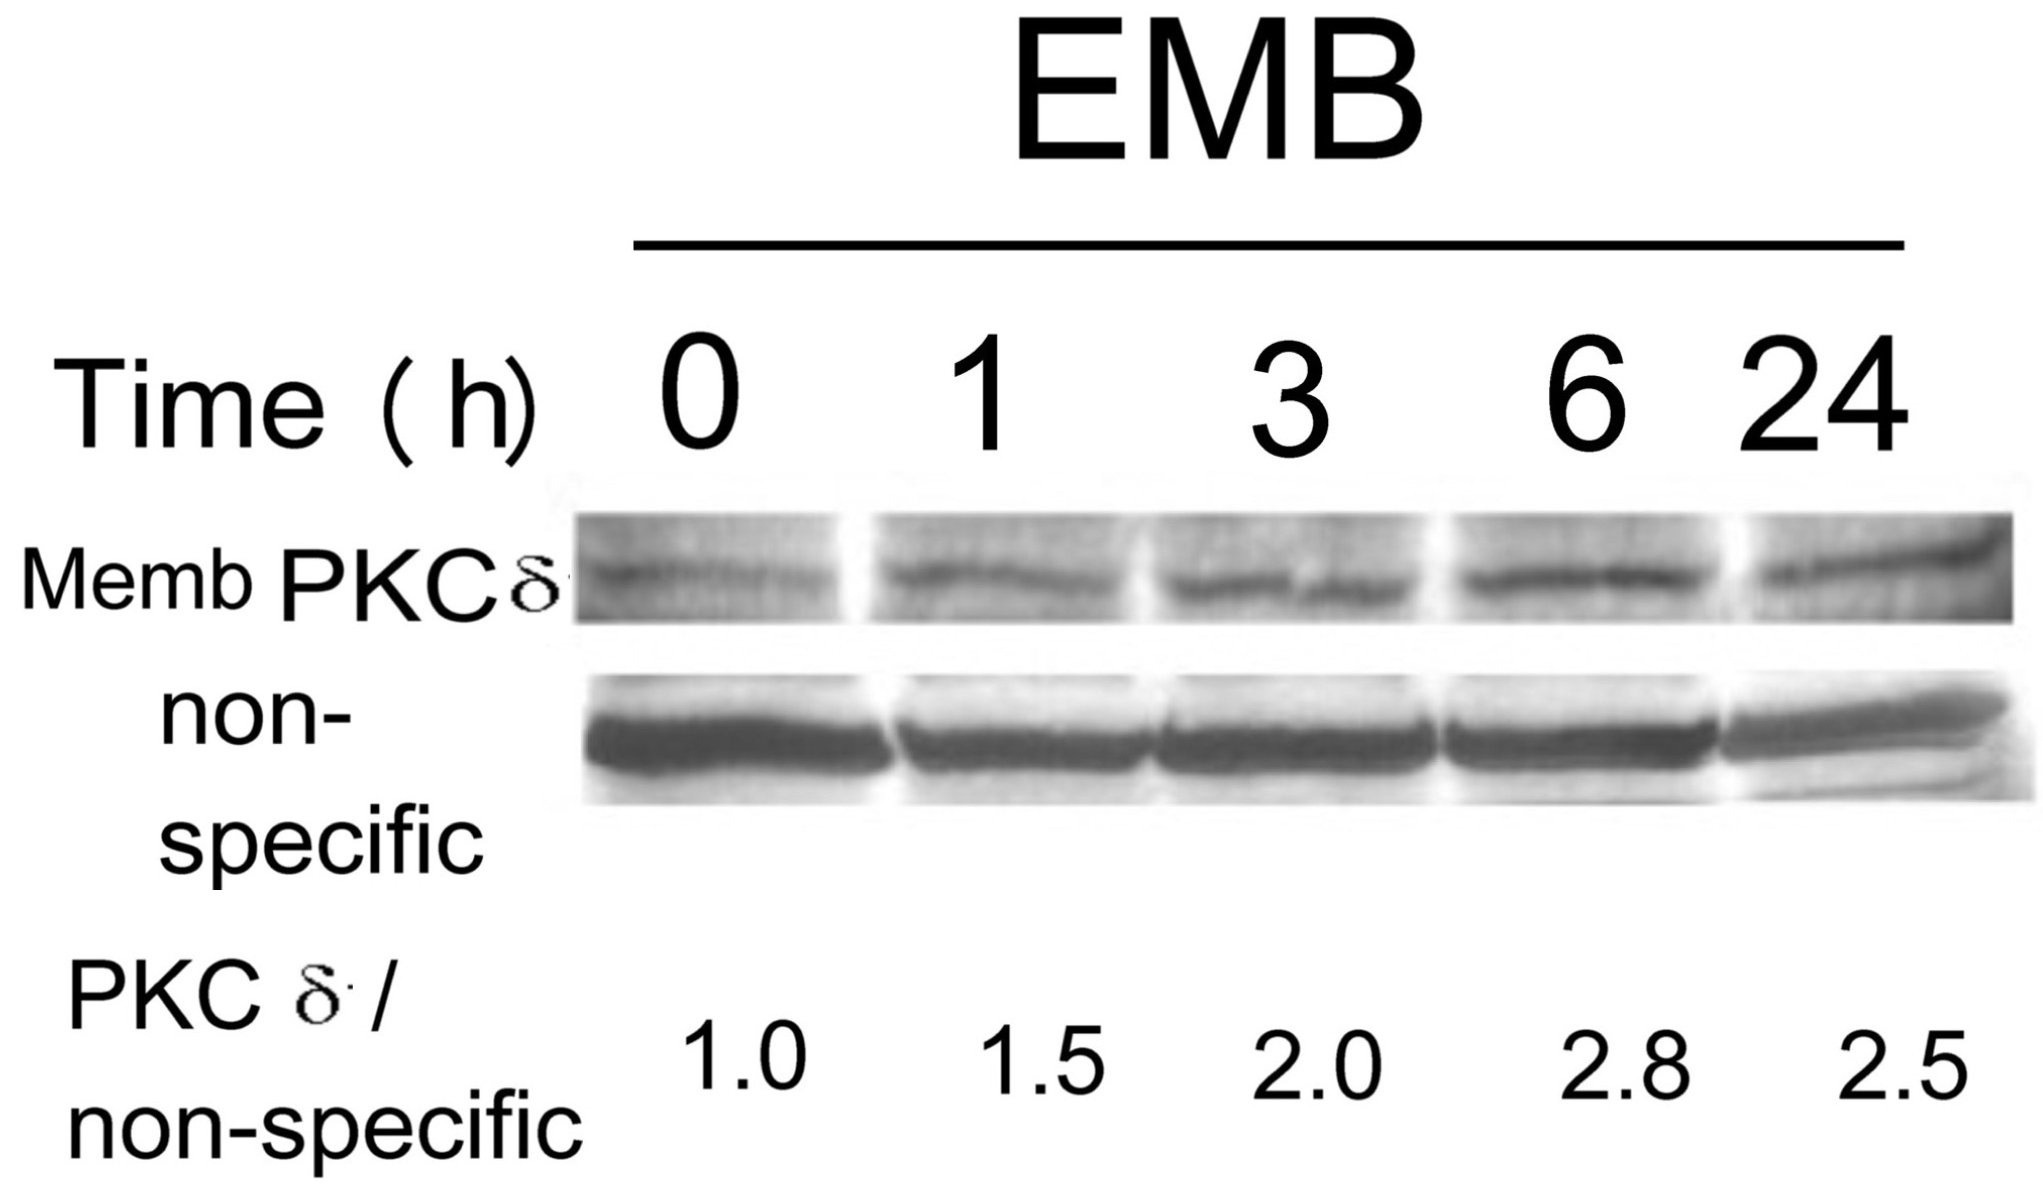
 Figure 6 of Tsai, Mol Vis 2011; 17:1564-1576.