Figure 10. Ethambutol (EMB) induced
release of cathepsin D from lysosome in RPE50 cells. RPE50 cells were
treated with 0.8 mM EMB for 0, 1, and 3 h. A western blot of cathepsin
D in the crude lysosomal fraction was performed. A nonspecific band in
the Ponceau S stained blot was included as an internal control. The
relative ratios of the band intensity of cathepsin D versus the
nonspecific band, taking the ratio at time zero as 1.0, are shown . The
results were an average of two repeated experiments with a coefficient
of variation (CV) of 6.0%–8.0%.
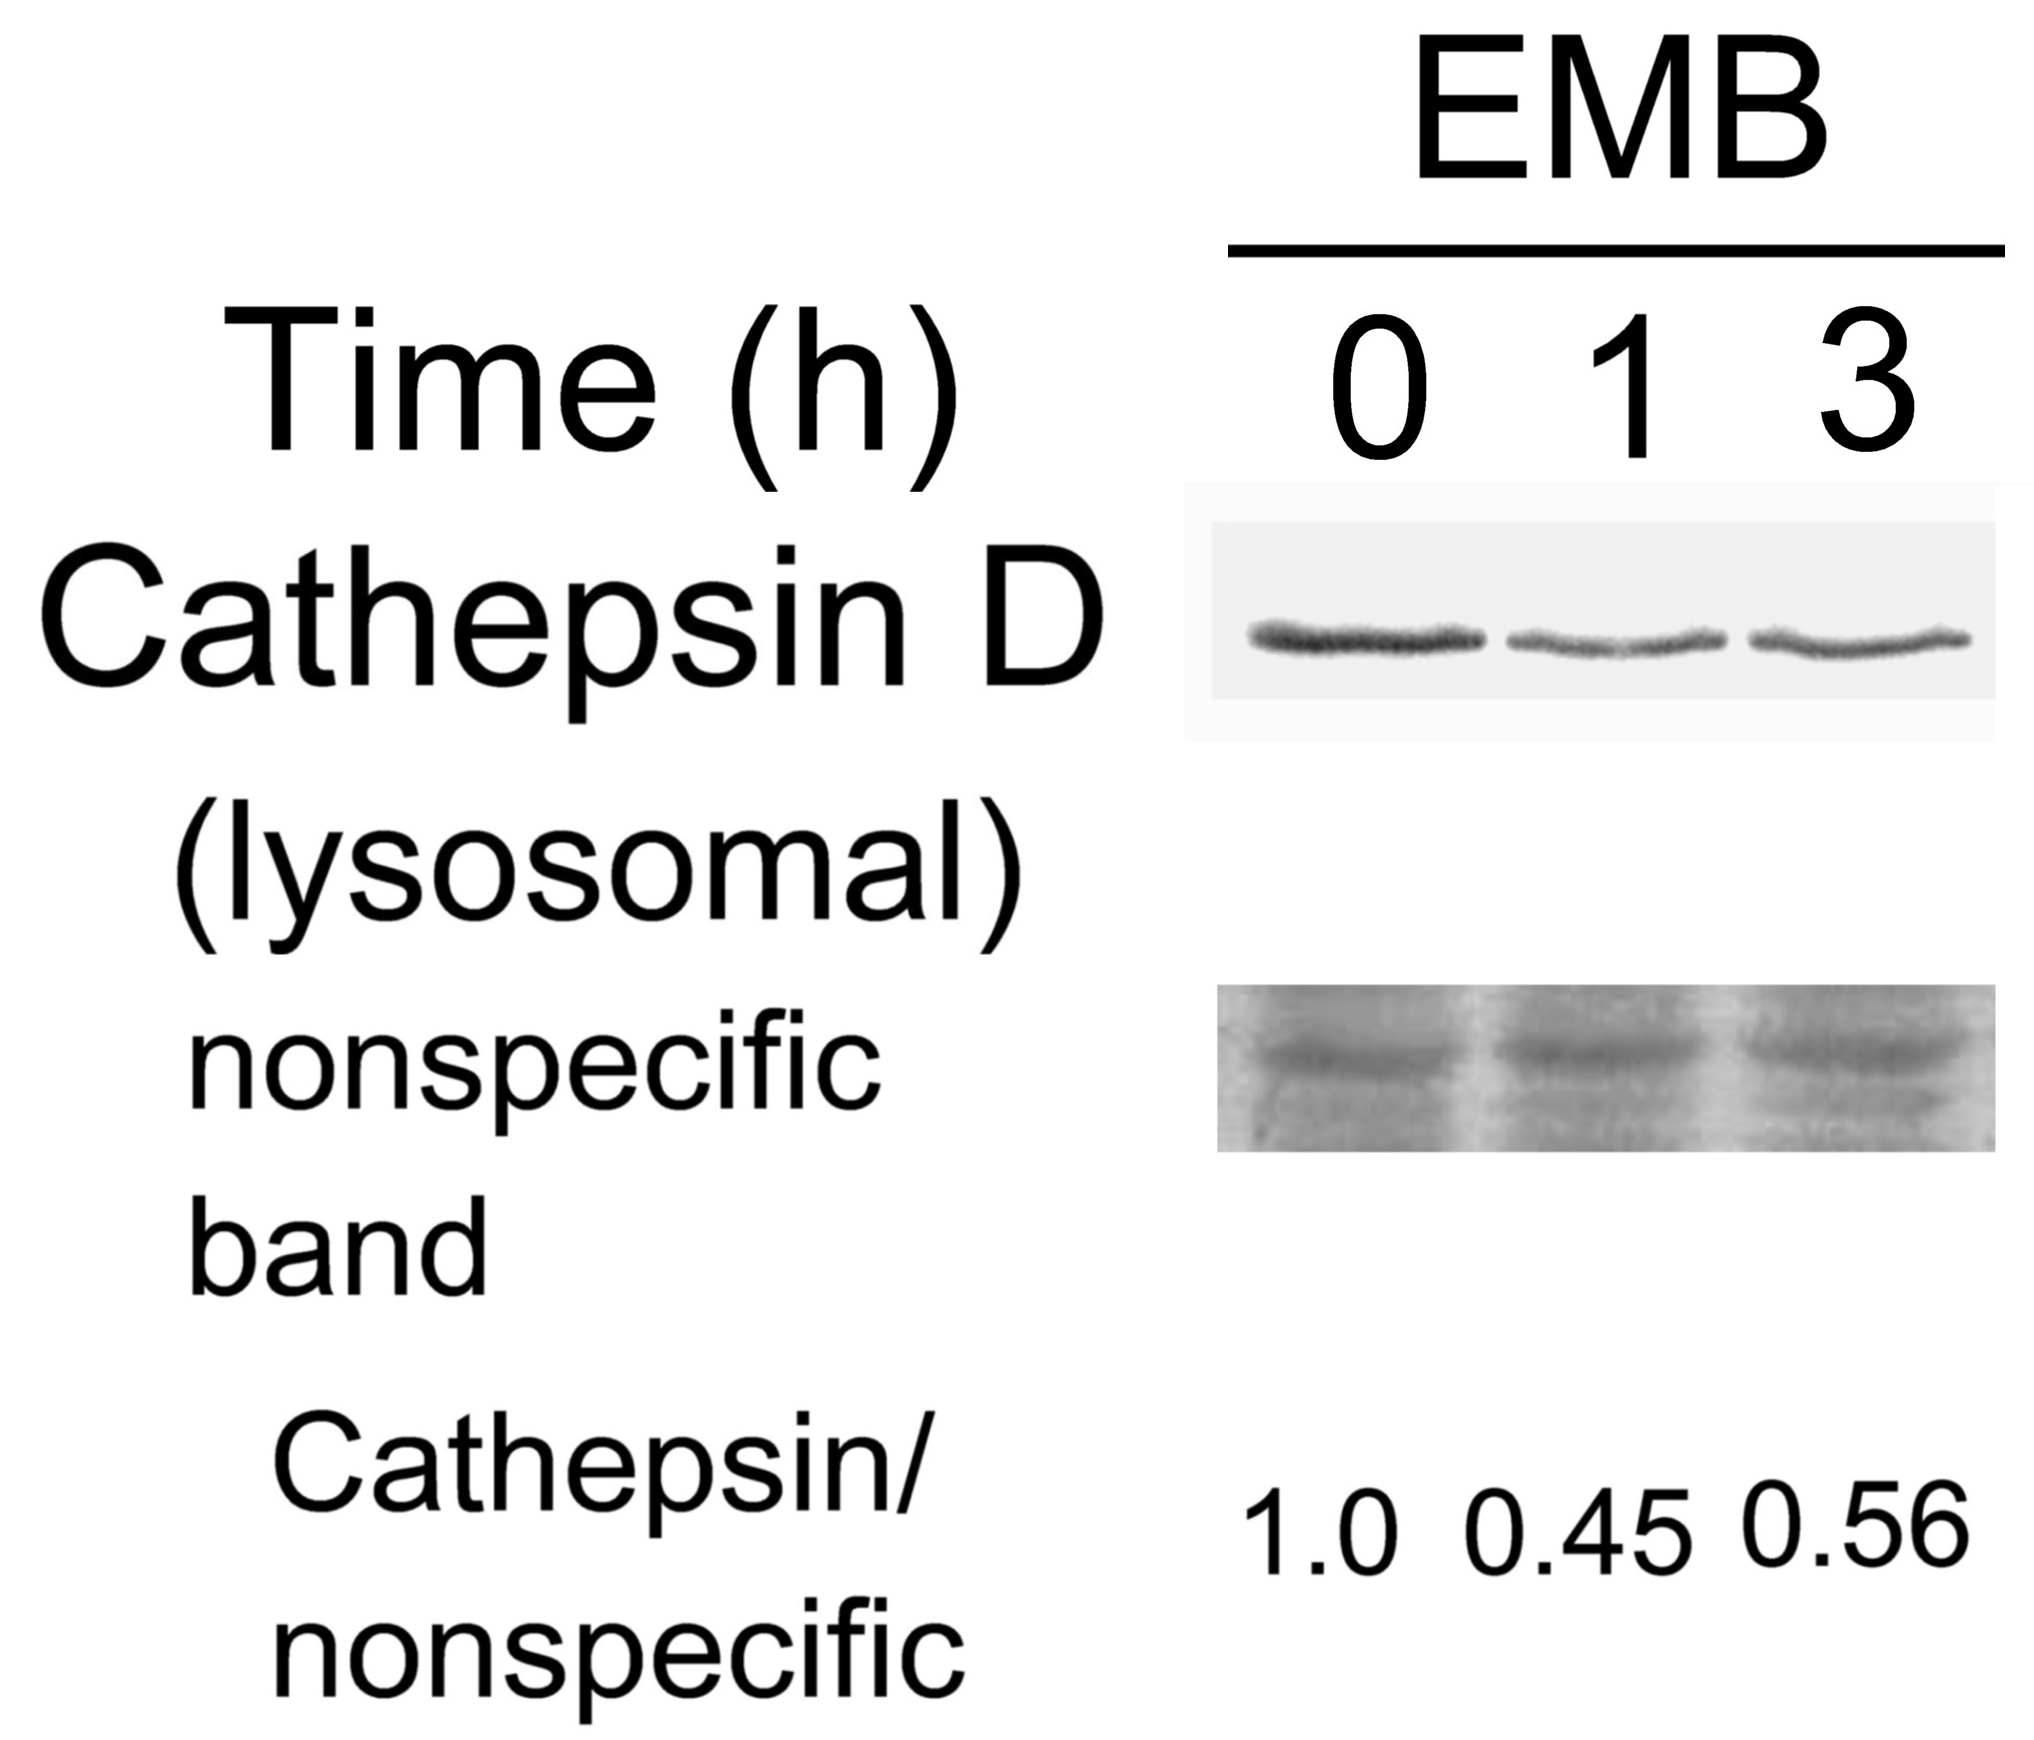
 Figure 10 of Tsai, Mol Vis 2011; 17:1564-1576.