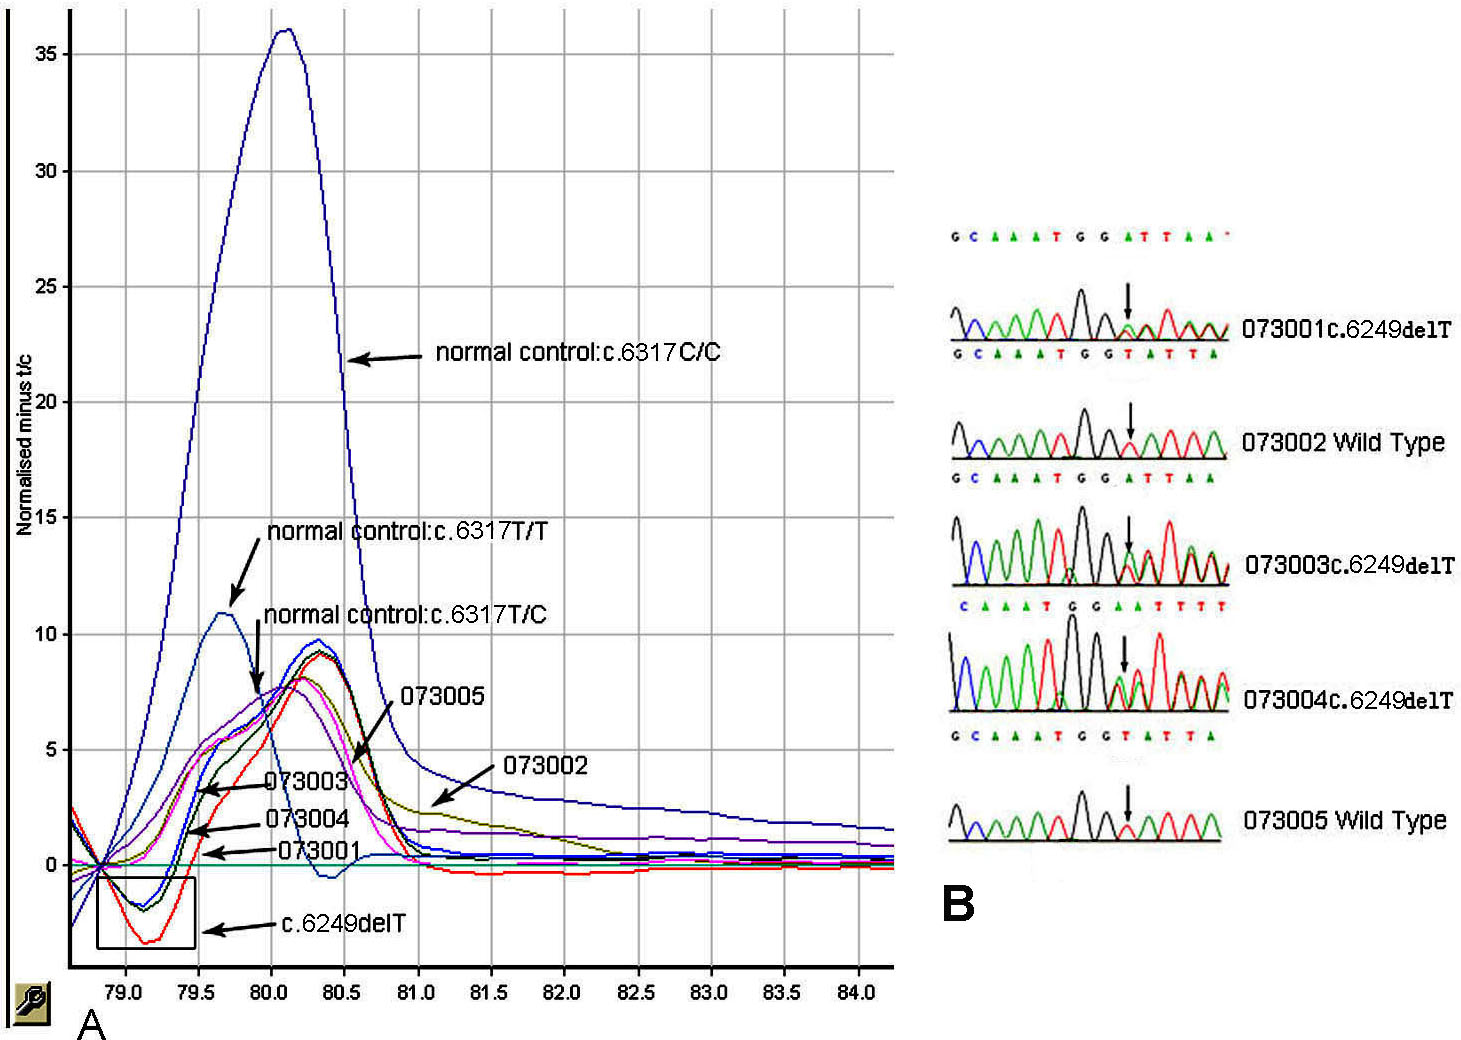
Figure 6. A high-resolution, melt curve
analysis (HRM) for the mutation c.6249delT (p. I2084fs) in family F6.
In the amplicon, there is a SNP
rs6657250,
c.6317T>C, as marked in the plot.
A: A difference plot for
the five members in family F6. The median green, straight line presents
the normal control with c.6317T>C. The real-time PCR products of the
family members are compared to the median normal control to produce the
plot. The curve revealed that the mutant pattern (area within the
rectangle) co-segregated with the affected individuals 073001, 073004,
and carriers, 073003, but not with the unaffected individuals 073002,
073005, and normal controls c.6317T/T or c.6317C/C.
B: Direct
sequencing analysis shows the heterozygous, one-base-deletion mutation
c.6249delT (p.I2084fs) in patients 073001 and 073004 and in the carrier
073003; sequences in individuals 073002 and 073005 are the wild type.
 Figure 6 of Xu, Mol Vis 2011; 17:1537-1552.