Figure 5. A single-strand, conformation, polymorphism analysis and a 16% denaturing polyacrylamide gel electrophorese analysis. A: Single strand conformation polymorphism (SSCP) analysis for the heterozygous mutation c. 1876C>T revealed that the mutant
pattern (four bands) co-segregated with the affected individuals and carriers, but not with the unaffected individuals and
normal controls (three bands). B: SSCP analysis for c.7123delG showed that the mutant pattern (three bands) co-segregated with the affected individuals and
carriers, but not with the unaffected individuals and normal controls (two bands). C: 16% denaturing polyacrylamide gel electrophorese analysis for the heterozygous mutation c.9472_9498delTGATGAG (p. D3165fs)
revealed that the mutant pattern (two bands) co-segregated with the affected individuals, but not with the unaffected individuals
and normal controls (one band). Participant identification numbers are listed above each lane and N represents the normal
controls.
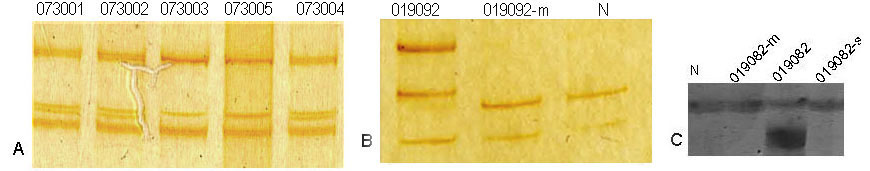
 Figure 5 of
Xu, Mol Vis 2011; 17:1537-1552.
Figure 5 of
Xu, Mol Vis 2011; 17:1537-1552.