Figure 2. Dexras1 protein level upregulated in the retina after light exposure. A: Total protein was extracted from normal and injured retinas at various times after light exposure, then assessed by western
blot analysis. B: Relative protein level represented a ratio between the amount of target gene and amount of endogenous glyceraldehyde-3-phosphate
dehydrogenase (GAPDH) control. Groups marked with an asterisk were significantly different from the normal group. The data
are means±standard error of mean (SEM; n=5, *p<0.05).
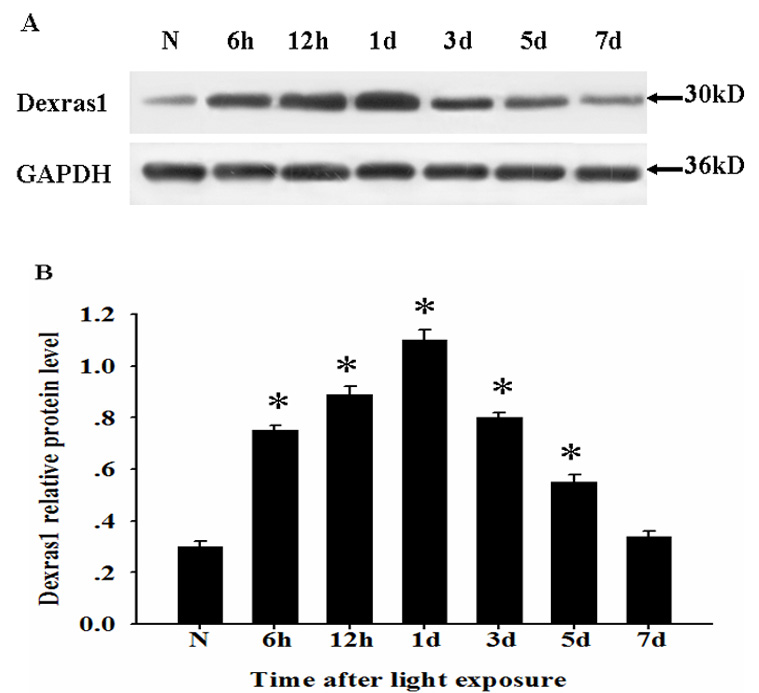
 Figure 2 of
Sang, Mol Vis 2011; 17:134-143.
Figure 2 of
Sang, Mol Vis 2011; 17:134-143.