Figure 2. IL-17 was expressed by both resident neural cells and infiltrating lymphoid cells within the eyes of EAU animals. Immunohistochemistry
with an IL-17-specific rabbit antirat antibody was employed to examine the intracellular staining on 7 (data not shown), 14,
21, 28, and 35 dpi of the retina and that of the CFA control at 14 dpi or vitreous cavity of the eye of EAU at 14 dpi. None-immune
rabbit IgG was used as the antibody isotypic control applied on the retina of the CFA control. A: IL-17 expression at the retinas. No disease and normal retinal architecture was observed at both the isotype antibody control
and CFA control. Disrupted retinal architecture and full-thickness retinal damage with intensive infiltrating cells were observed
at 14 dpi, but the normal retina structure was gradually restored after 21 dpi. IL-17-positive staining was detected at the
layer where retinal ganglion cells (RGC) and retinal astrocytes resided at the retina, with light staining at the retina of
the CFA control and strong staining at 14, 21, 28, and 35 dpi of retinas of EAU rats (arrows). The network of neural processes
also stained positively for IL-17. Closer observation on some of the positive-staining cells indicated that these cells morphologically
resembled astrocytes (EAU 28 dpi, insert with the arrow). Furthermore, a certain amount of the infiltrating cells at 14 dpi
of the EAU group also indicated positive staining (arrowhead). The size bar represents 50 μm (40×). B: GFAP+ retinal astrocytes and Tuj-1+RGC reside at the RGC layer of the retina. GFAP (Green); Tuj-1 (red), and DAPI (blue).
C: Selected IL-17 expression at the vitreous cavity within the eyes of EAU 14 dpi. A significant amount of the infiltrating
cells in the vitreous cavity within the eyes of EAU 14 dpi showed strong intracellular staining of IL-17 (arrowhead). The
morphology of positive-staining cells infiltrating the retinas resembled cells of lymphoid origins. Data represent at least
three repeated experiments. The size bar represents 50 μm (40×).
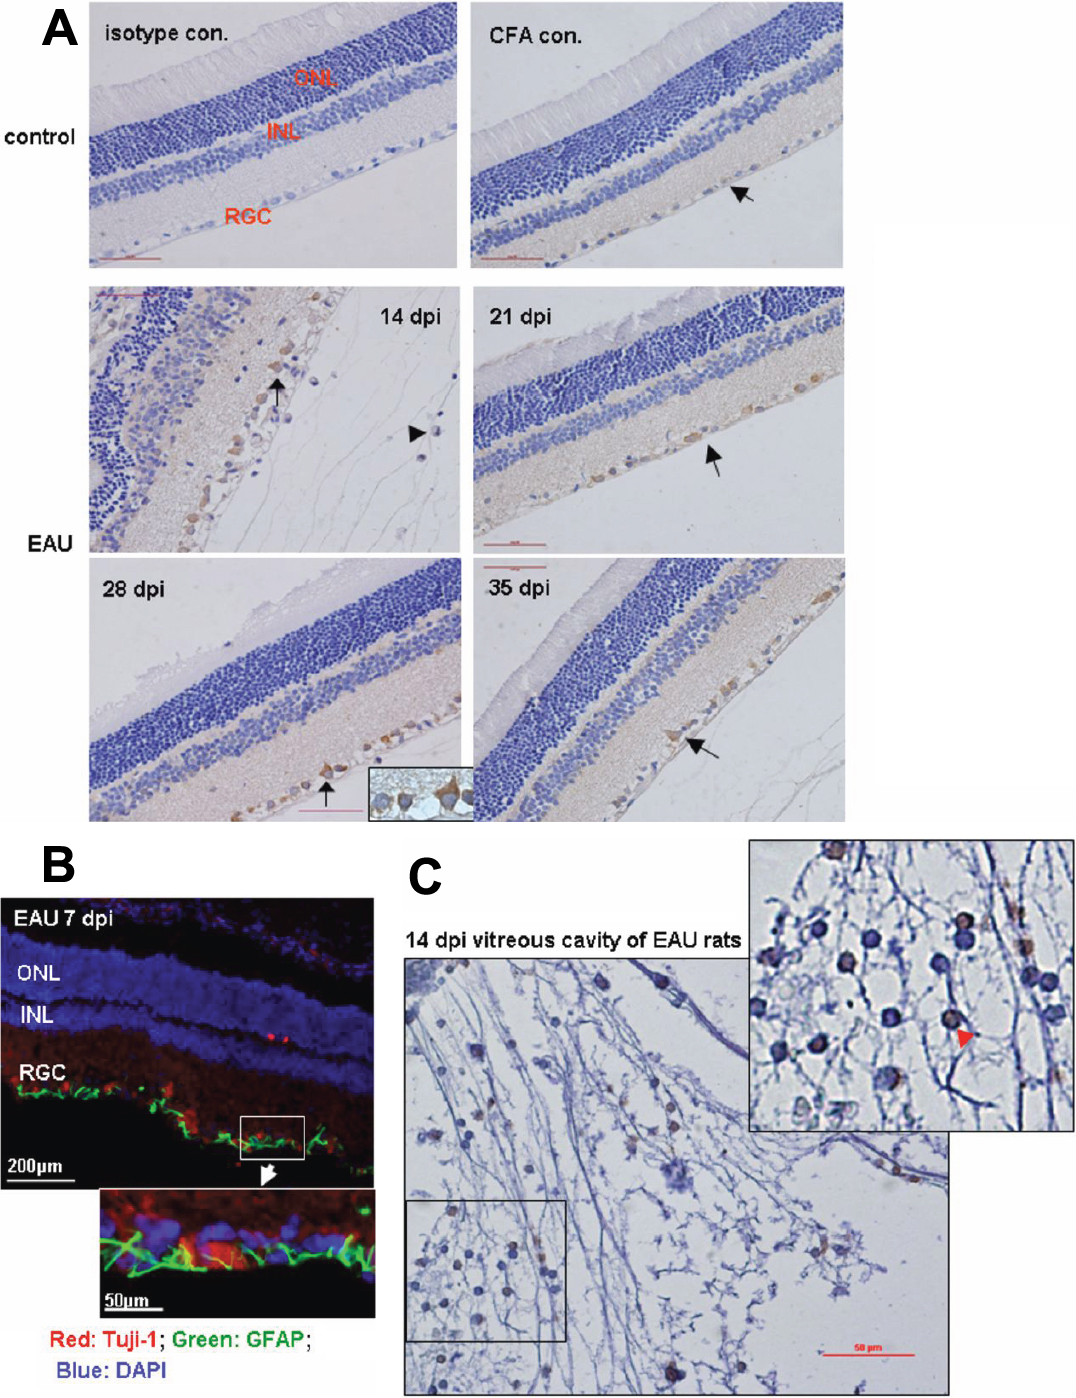
 Figure 2 of
Jia, Mol Vis 2011; 17:1493-1507.
Figure 2 of
Jia, Mol Vis 2011; 17:1493-1507.