Figure 7. Insulin receptor, insulin-like
growth factor-1 receptor, and insulin-like growth factor–1 mRNA levels
after 24 h of plus (+7D) and minus (−7D) lens treatment in the
cartilaginous sclera (A) and fibrous sclera (B). Results
are expressed as the mean normalized expression (MNE)±SEM. Nine animals
were analyzed per group. Statistically significant differences between
the treated groups and the control, as determined by one-way ANOVA
(ANOVA) are denoted in the graph (* for p<0.05 and ** for
p<0.01). In the cartilaginous sclera, the mRNA contents of the two
receptors were not significantly different. In the fibrous sclera, the
expression of the insulin and the insulin-like growth factor (IGF)-1
receptor (IGF-1R) was higher in the minus lens–treated group compared
to controls.
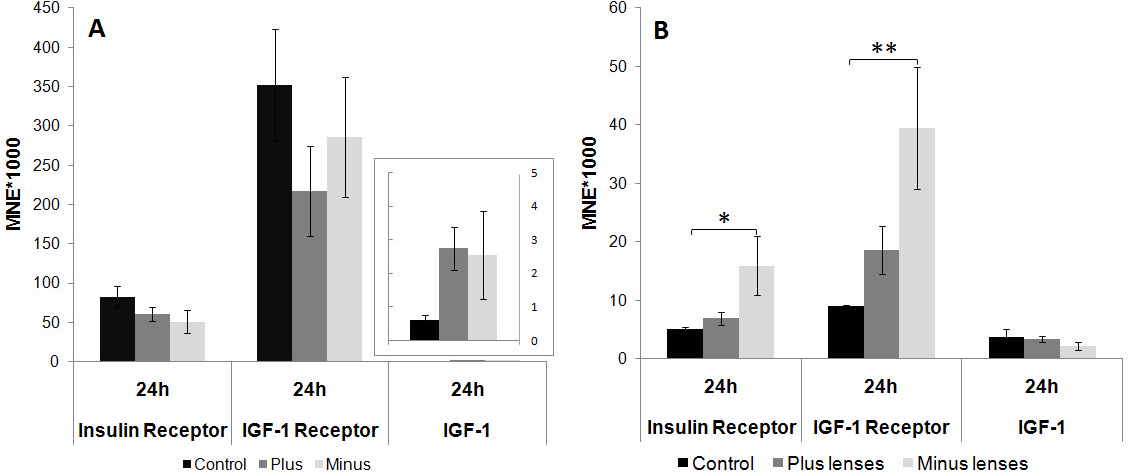
 Figure 7 of Penha, Mol Vis 2011; 17:1436-1448.