Figure 5. Insulin receptor, insulin-like
growth factor-1 and insulin-like growth factor–1 receptor mRNA levels
after 4 and 24 h of plus (+7D) and minus (−7D) lens treatment in the
retinal pigment epithelium. Results are expressed as the mean
normalized expression (MNE)±SEM. For the 4 h experiment, six animals
per groups were used; 9 per group were used for the 24 h experiment.
Statistically significant differences between the treated groups and
the control as determined by one-way ANOVA (ANOVA) are denoted in the
graph (* for p<0.05). Insulin receptor (IR) and insulin-like growth
factor (IGF)-1 receptor (IGF-1R) mRNA levels were lower after 4 h of
plus lens treatment compared to untreated control animals. In addition,
IGF-1 mRNA levels were significantly lower after 4 h of plus lens
treatment compared to the minus lens–treated animals. After 24 h of
lens treatment, there were no significant differences in all genes,
between all groups.
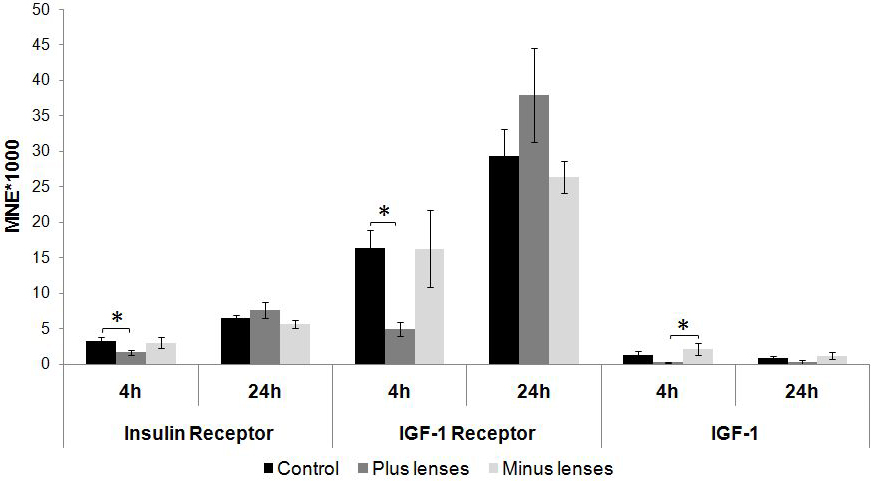
 Figure 5 of Penha, Mol Vis 2011; 17:1436-1448.