Figure 2. Quantification cycle values for
two different regions of the insulin receptor sequence in different
tissues are shown. All tissues expressed the insulin receptor tyrosine
kinase domain mRNA as well as the insulin receptor L2-rich binding
domain mRNA. The sample size is 4 animals per tissues. Error bars
represent the standard error of the mean.
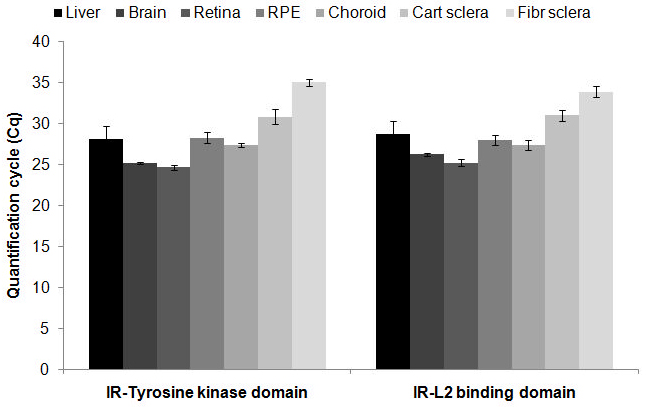
 Figure 2 of Penha, Mol Vis 2011; 17:1436-1448.