Figure 1. Distribution of high-risk (dark shaded) and low-risk (light shaded) genotypic combinations of the markers studied. The summary
of the distribution illustrates the no. of patients (left bars) and controls (right bars) for each genotype combinations.
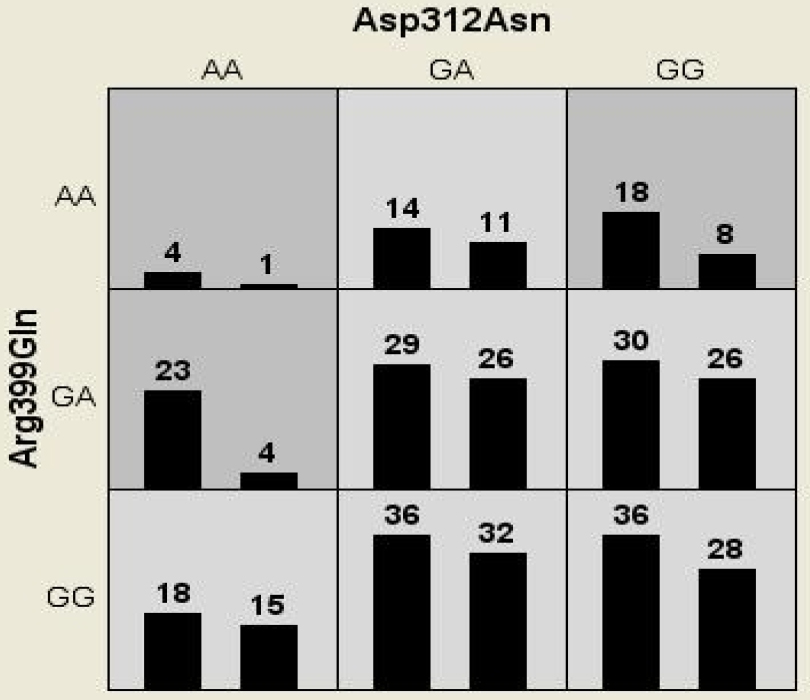
 Figure 1 of
Padma, Mol Vis 2011; 17:127-133.
Figure 1 of
Padma, Mol Vis 2011; 17:127-133.