Figure 1 of
Awadalla, Mol Vis 2011; 17:1420-1424.
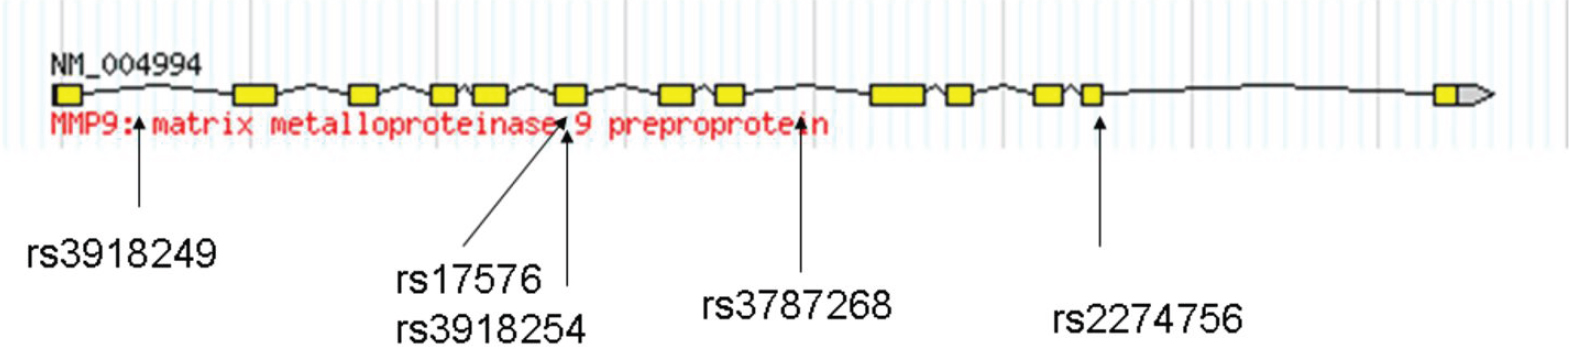
Figure 1.
MMP9
gene schematic representation, indicating tag SNP location. Exons are indicated by boxes and joined by introns indicated by solid lines. Figure adapted from the
HapMap
website.
 Figure 1 of Awadalla, Mol Vis 2011; 17:1420-1424.