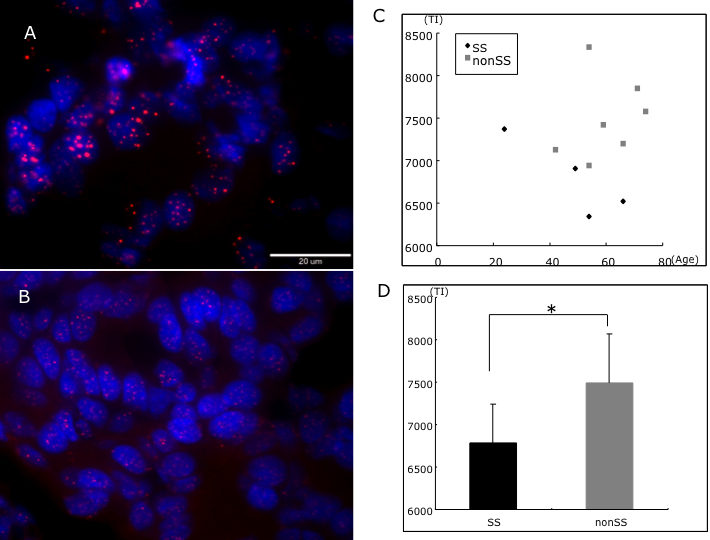
Figure 1. Telomere shortening in Sjögren
syndrome. Representative telo-FISH photograph of non-Sjögren syndrome (A)
and
Sjögren syndrome (B) lacrimal glands. Scatter plot of age
and telomere intensity (TI; C). Comparison of average telomere
intensity in Sjögren and non-Sjögren syndrome groups demonstrated that
telomeres were significantly shorter in Sjögren syndrome group (D;
p=0.02).

 Figure 1 of Kawashima, Mol Vis 2011; 17:1397-1404.
  Figure 1 of Kawashima, Mol Vis 2011; 17:1397-1404.