Figure 5. A network graph representing the growth associated protein43/ phosphatase tensin homolog (Gap43/Pten) network and the potential components for upstream modulation of the Gap43/Pten network. This network graph produces a relational Gap43/Pten network shown in blue. The colored lines represent the direct correlative relationship and the strength of the correlation
is −1.0 to 1.0. The genes denoted in red: Basic helix loop helix beta4 (Bhlhb4), teashirt zinc finger homeobox 2 (Tshz2), and RNA export protein1 homolog (Rae1) are candidates from chromosome 2, cis-acting QTLs between 169 Mb and 182 Mb. The genes illustrated in green are the candidate
genes located on chromosome 15 between 82 Mb and 92 Mb; phosphomannomutase1 (Pmm1), copine VIII (Cpne8), RAB, member of RAS oncogene family-like 2A (Rabl2a), and fibulin 1 (Fbln1).
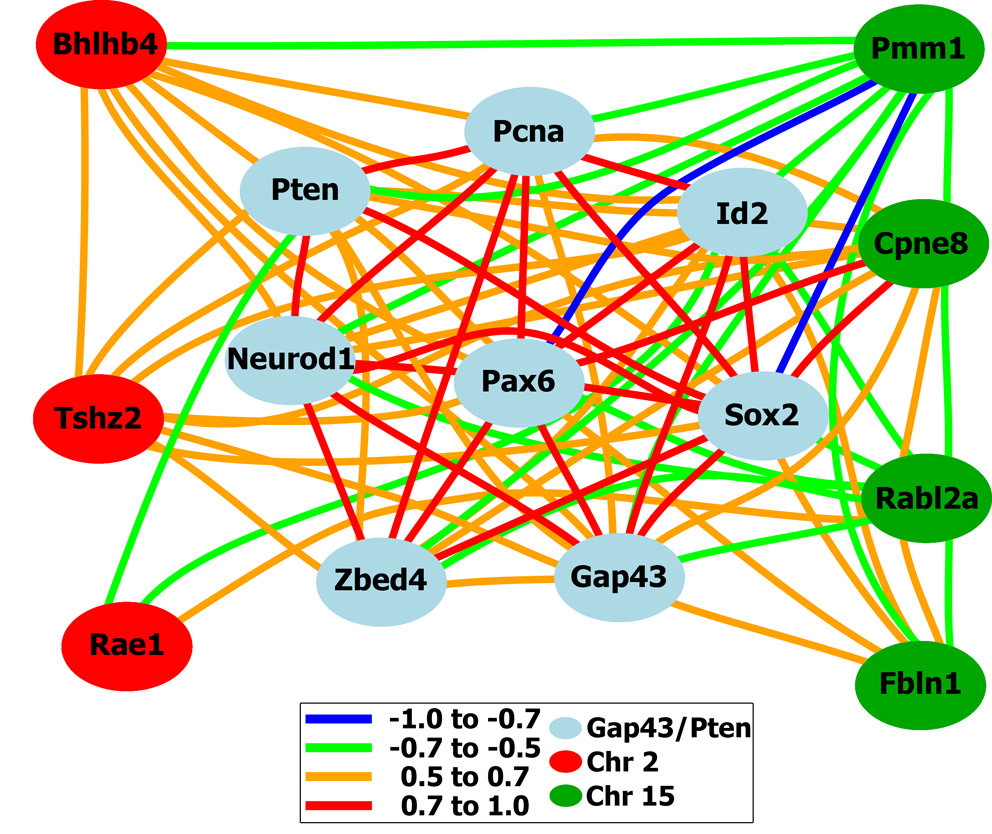
 Figure 5 of
Freeman, Mol Vis 2011; 17:1355-1372.
Figure 5 of
Freeman, Mol Vis 2011; 17:1355-1372.