Figure 4. Quantitative trait loci (QTL)
Heat Map of the top 100 correlates of phosphatase tensin homolog (Pten).
The
numbers to the left denote the top 100 genes that correlate with Pten
and the chromosomal location is noted at the bottom of the heat map
ranging from chromosome 1 on the left to chromosome X on the right. The
banding pattern is displayed in yellow, red, green, and blue, which
denote the locations of the genomic loci that modulate all of the genes
in the network. The green (low likelihood ratio statistic; LRS) to blue
(high LRS) coloring represents transcripts whose expression is higher
in the strains with a B haplotype (C57BL/6J) and the yellow (low LRS)
to red (high LRS) coloring corresponds to the transcripts whose
expression is higher in the strains with mutant D haplotype (DBA/2J).
The red arrows indicate the most prominent bands with significant QTLs
and portray the signature bands of the Pten network chromosomes
1, 2, 12, 15, 16, and 19.
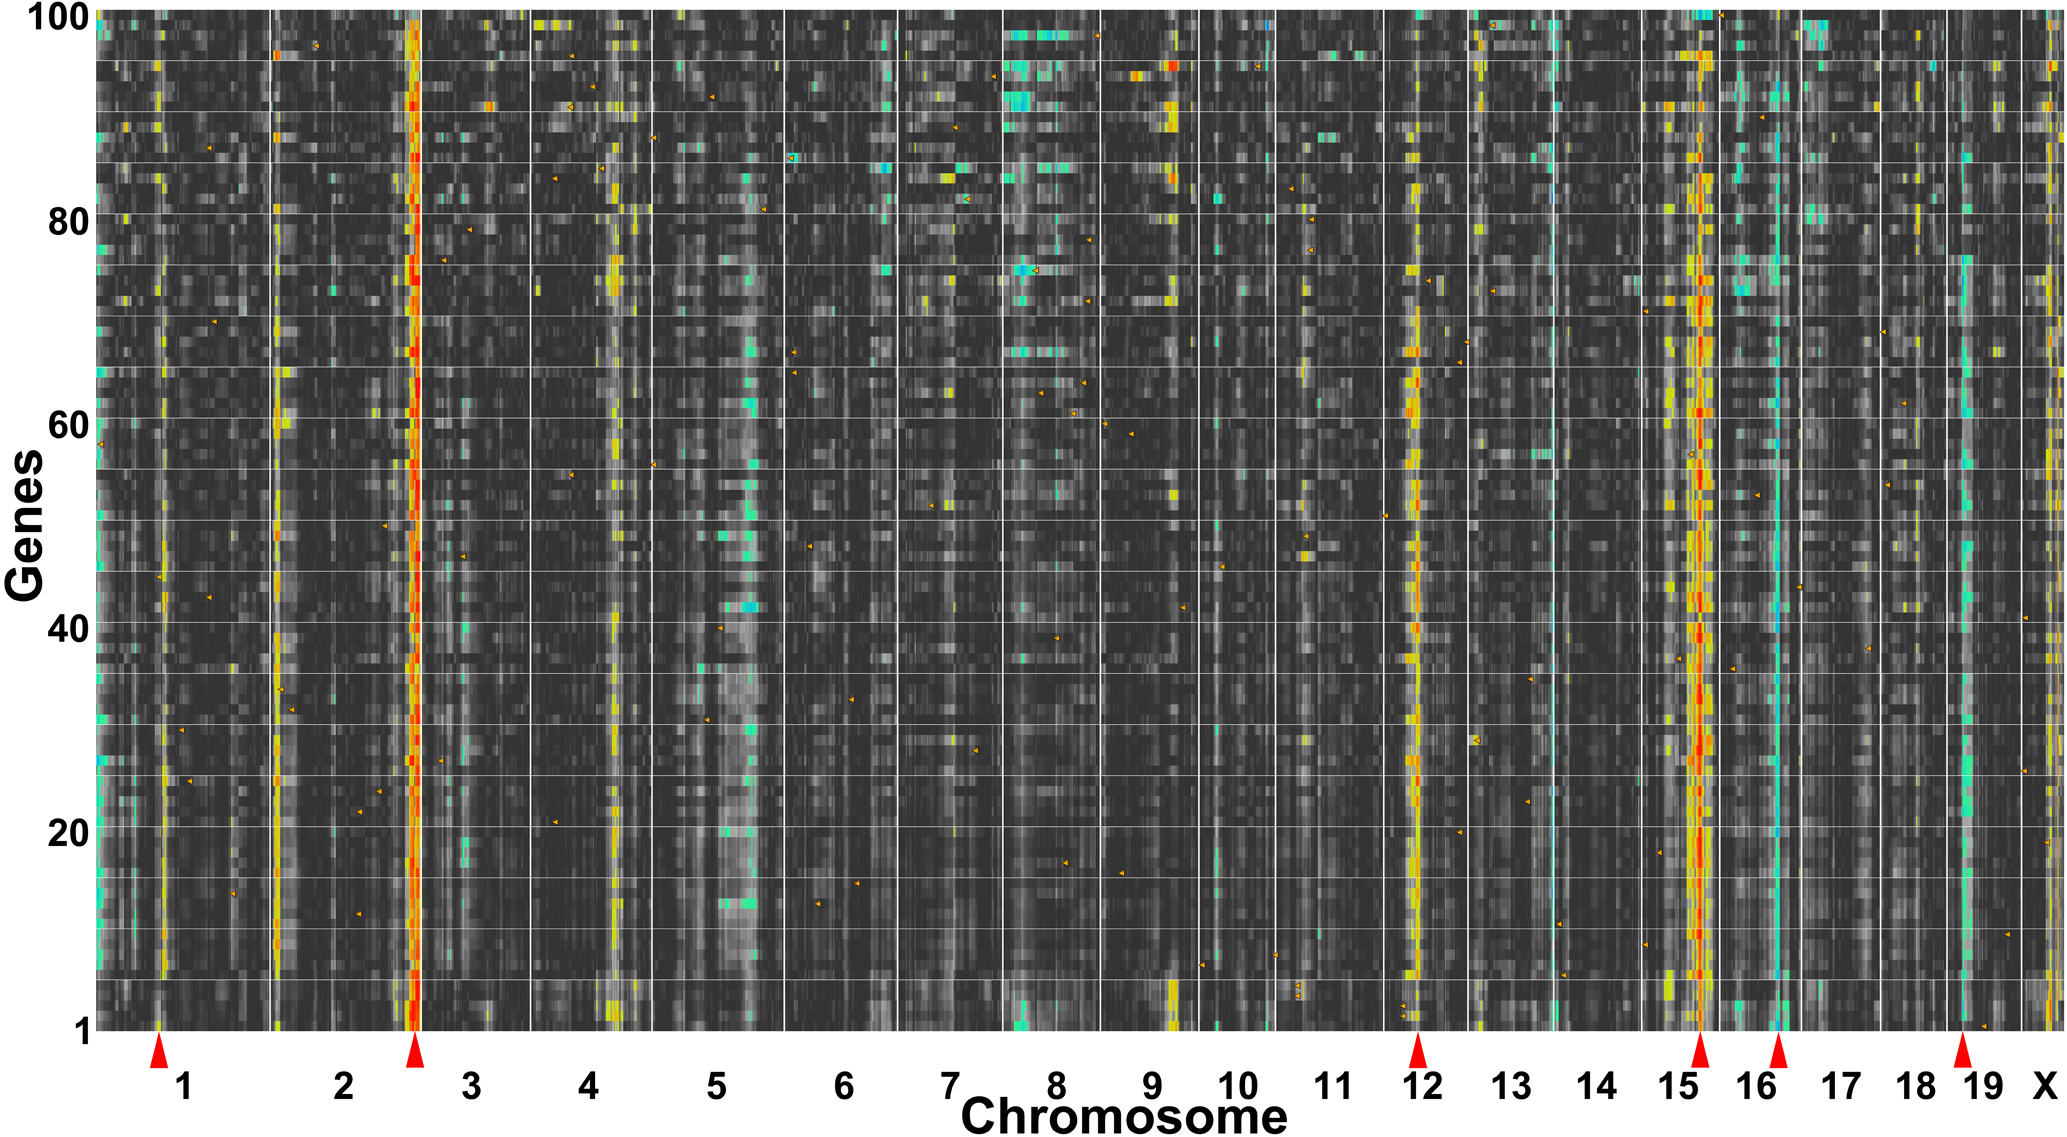
 Figure 4 of Freeman, Mol Vis 2011; 17:1355-1372.