Figure 3. The cellular signatures of
growth associated protein 43 (Gap43), retinal pigment
epithelium-specific protein 65 kDa (Rpe65), and choline
O-acetyltransferase (Chat) illustrated by quantitative trait
loci (QTL) heat maps. The correlation matrices within GeneNetwork were
used to simultaneous map and analyze the top 80 genes in the trait
collections of A: Gap43, B: Rpe65, and C: Chat.
The gene collections from Gap43, Rpe65, and Chat
form unique signatures within the retina transcriptome. The numbers to
the left denote the correlation range and at the bottom of the heat
maps the chromosomal location is noted ranging from chromosome 1 on the
left to chromosome X on the right. The banding pattern is displayed in
yellow, red, green, and blue, which denote the locations of the genomic
loci that modulate all of the genes in the network. The hues: yellow,
red, green, and blue represent significant QTLs. The green (low LRS) to
blue (high LRS) coloring represents transcripts whose expression is
higher in the strains with a B haplotype (C57BL/6J) and the yellow (low
LRS) to red (high LRS) coloring corresponds to the transcripts whose
expression is higher in the strains with mutant D haplotype (DBA/2J).
The red arrows indicate that some of the bands are more prominent.
Running a QTL cluster map in GeneNetwork reveals a strong QTL signature
of Gap43, forming a potential genetic network. Signature QTLs
(highlighted with red arrows) for Gap43 were found on
chromosomes 1, 2, 7, 12, 15, 16, and 19. These are regions of the
genome that contain loci modulating the expression of genes within the Gap43
network (A). Rpe65 forms signature QTLs on chromosomes
1, 9, and 16 (B) and Chat forms signature QTLs on
chromosomes 1, 5, 7, and 9 (C).
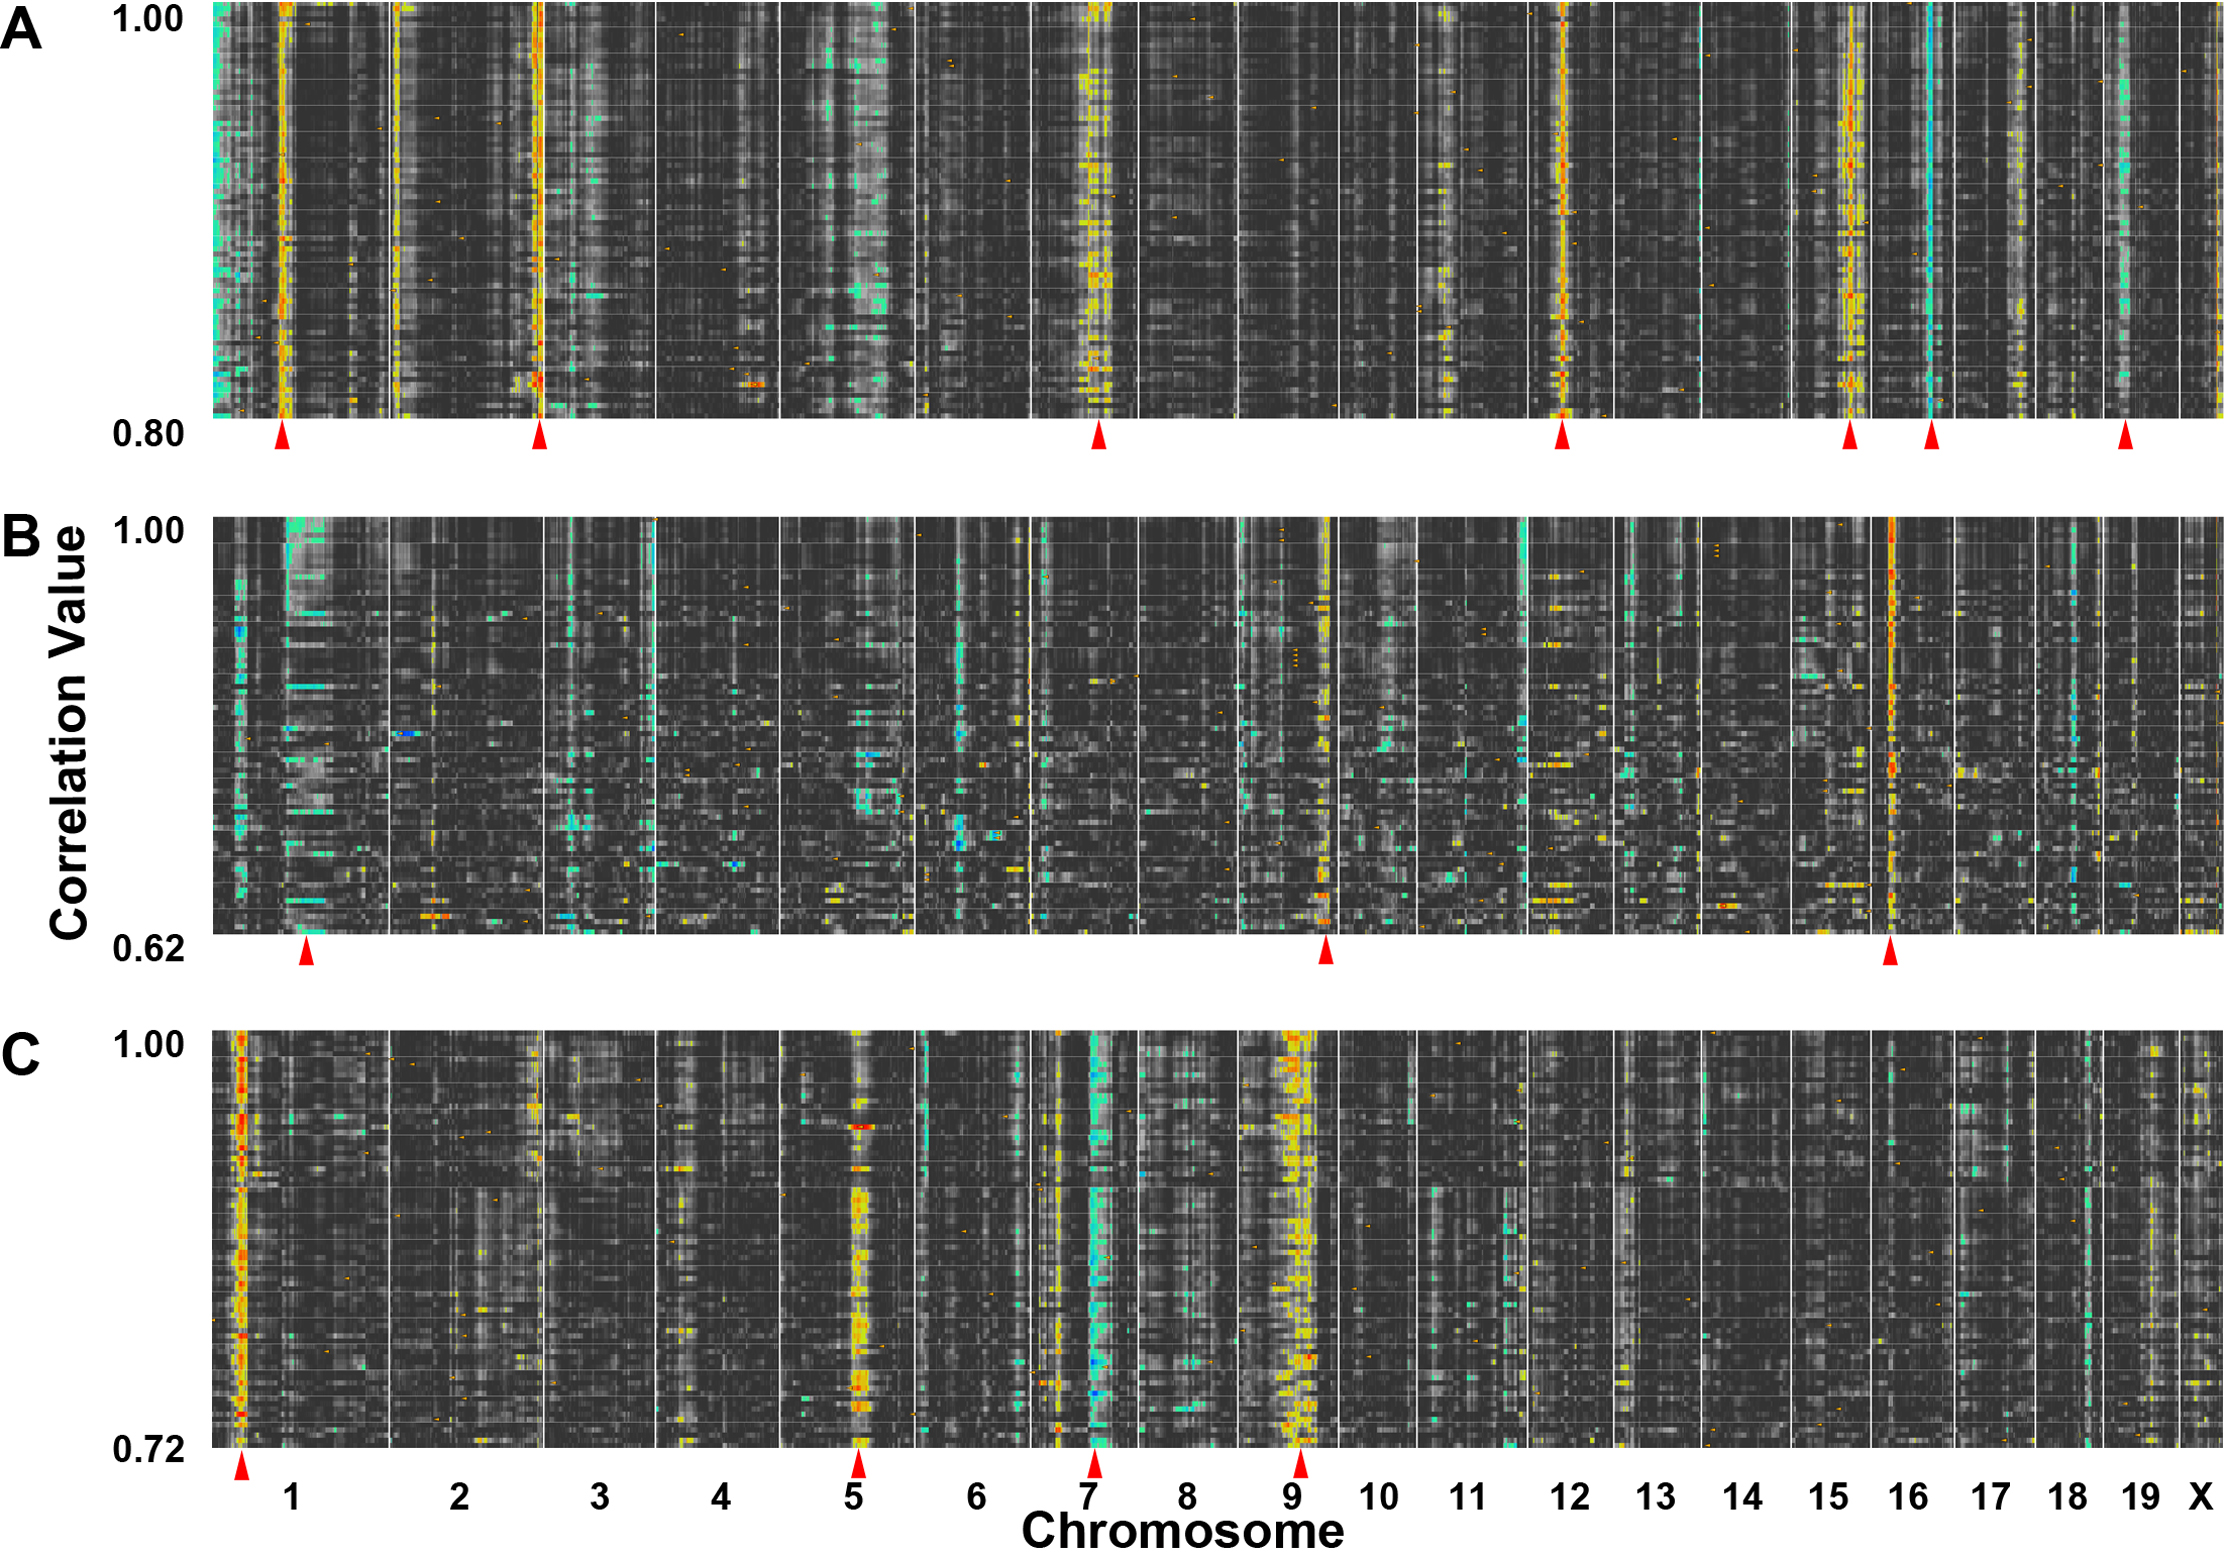
 Figure 3 of Freeman, Mol Vis 2011; 17:1355-1372.