Figure 2. A genome-wide graph displaying
the quantitative trait loci (QTL) distribution across the Hamilton Eye
Institute (HEI) Retina Database. Each point on the graph represents a
single probe set. The x-axis plots the locations of the QTLs
controlling the transcript expression. Positions are measured in mega
bases (Mb) from chromosome 1 to chromosome X (1–2600 Mb). The y-axis
plots the chromosomal location of each of the transcripts. The
significant levels of individual QTLs are color-coded. The low genome
wide p-value or high likelihood ratio statistic (LRS) are represented
by red, the intermediate p-value/LRS values are green, and the high
genome-wide p-value/low LRS values are presented in blue. The diagonal
(red) band plots the large number of highly significant cis-acting QTLs
and the vertical bands represent major trans-acting QTLs that
co-regulate large numbers of downstream transcripts. These data were
plotted from the HEI Retina Database with a false discovery rate of 0.2.
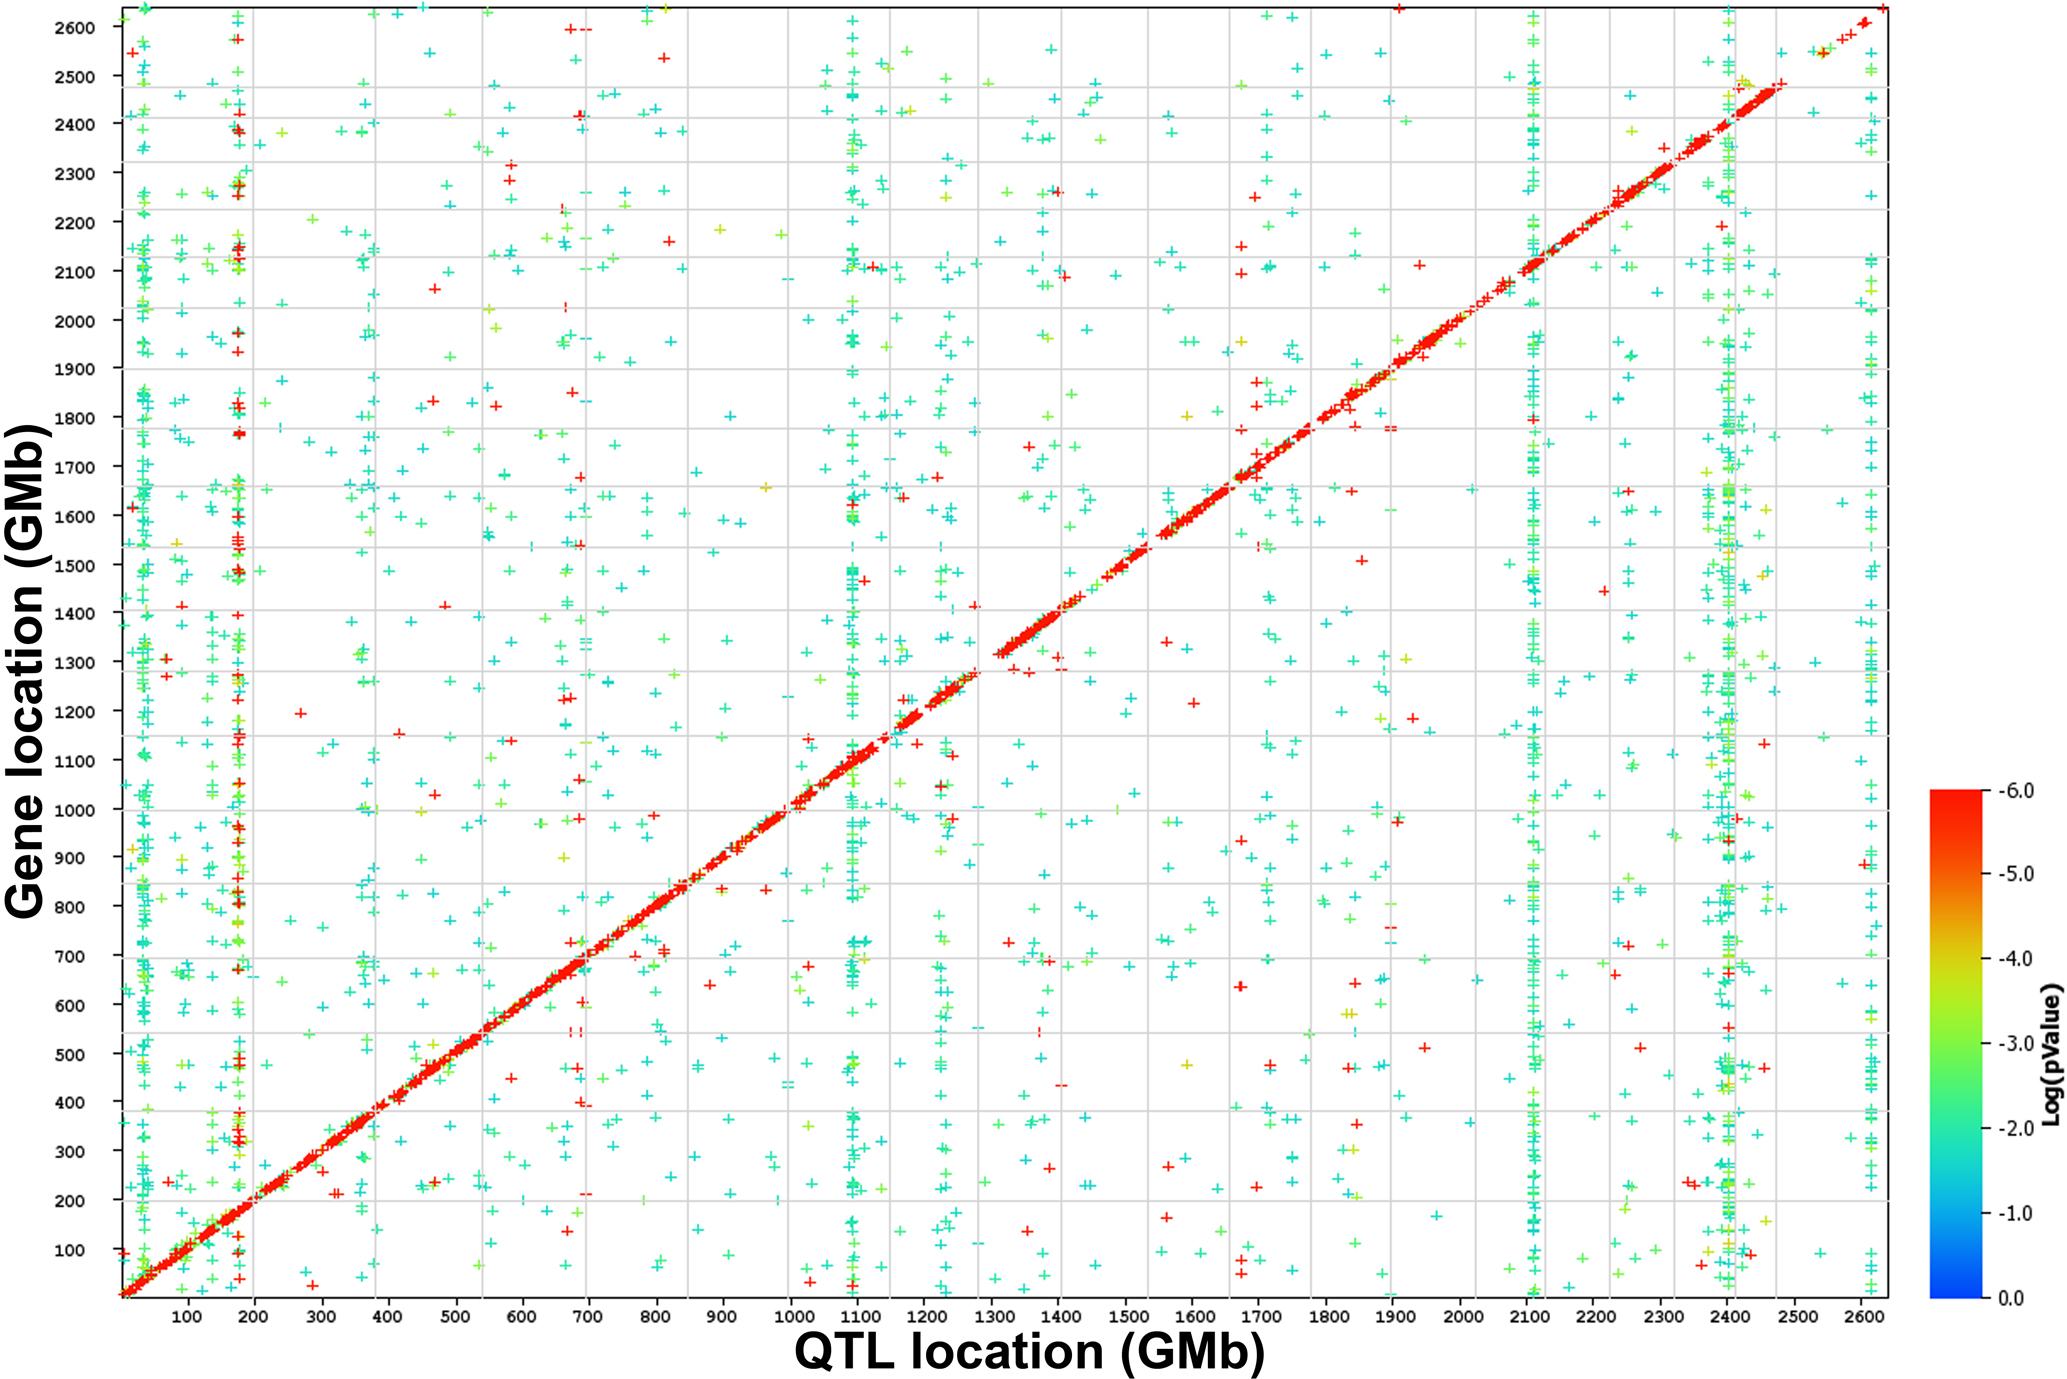
 Figure 2 of Freeman, Mol Vis 2011; 17:1355-1372.