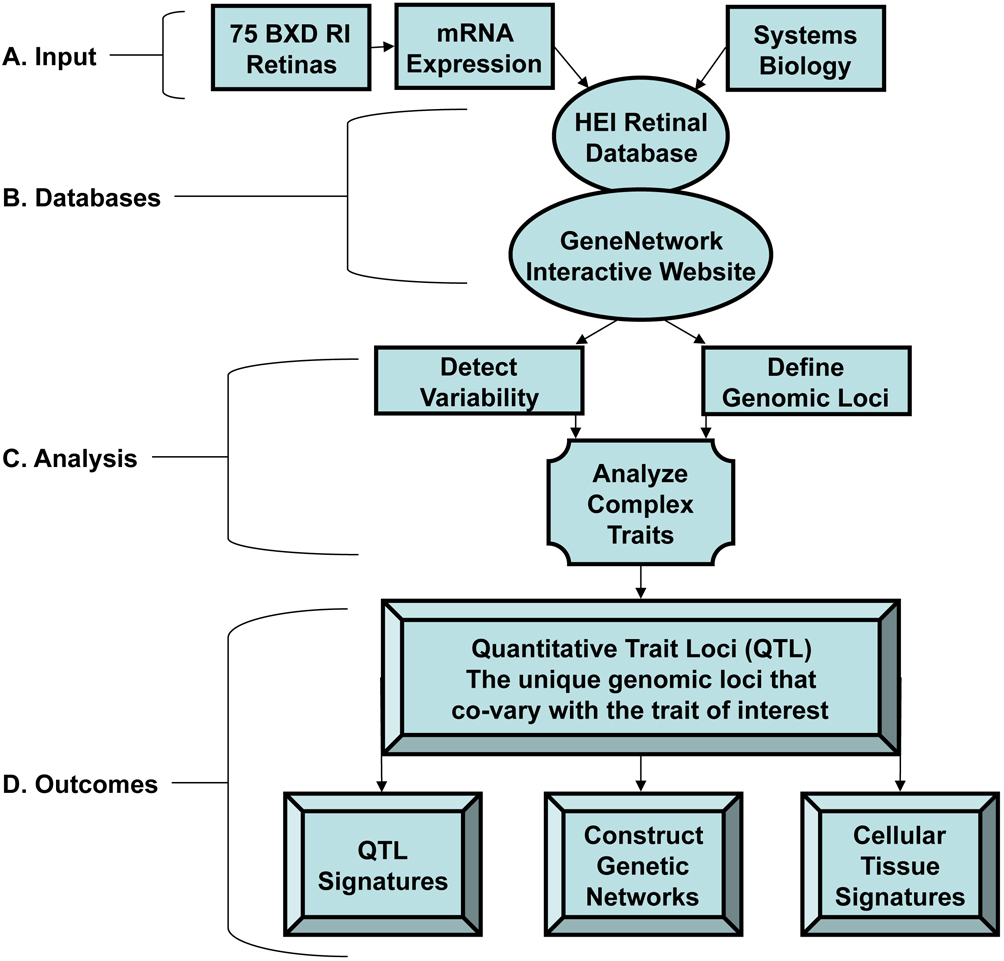
Figure 1. The Hamilton Eye Institute (HEI) Retina Database and
GeneNetwork can reveal the covariance in gene expression that establishes genetic networks in the retina.
A: Input: A systems biology approach and the microarray data from 75 BXD RI mouse retinas feed into the HEI Retina Database.
B: Databases: The HEI Retina Database links to the interactive
GeneNetwork Database website.
C: Analysis: The analytical tools within
GeneNetwork are used to interrogate the data set and detect the co-variance among sets of genes that map to a common genetic locus and
collectively control a complex trait.
D: Outcomes: Identify the unique genomic loci that co-vary with the trait of interest, which lends to the discovery of quantitative
trait loci (QTL), cellular, and tissue signatures. These signatures allow the construction of schema for genetic networks.
 Figure 1 of
Freeman, Mol Vis 2011; 17:1355-1372.
Figure 1 of
Freeman, Mol Vis 2011; 17:1355-1372.