Figure 9 of
Meloni, Mol Vis 2011; 17:113-126.
Figure 9.
Histological analysis.
A
: Normal morphology of control HCE with saline solution.
B
: Epithelial thickness reduced in EDEV-HCE.
C
: Hyalistil
®
;
D
: Etacortilen
®
;
E
: Xiloial
®
;
F
: TSP 0,5%
®
;
G
: Optive
®
. Magnification 20×.
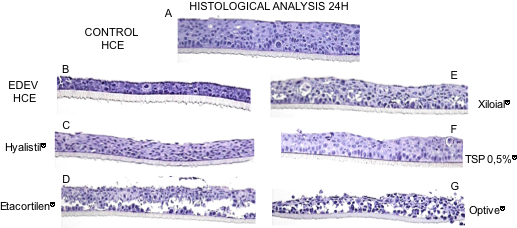
 Figure 9 of Meloni, Mol Vis 2011; 17:113-126.