Figure 8. Results of EDEV biomarkers gene
expression study. Real-time PCR analysis showing the relative changes
of TNF-α (A), MMP9 (B), MUC4 (C),
and
DEFB2 (D) mRNA after 24 h treatment on
established EDEV model. A twofold change of Relative Quantification
(RQ) is usually considered significant in comparison to the calibrator
(CONTROL-HCE at each time point). A two-tailed Student’s t-test
was used to determine statistical significance for real-time PCR. All
the data presented in this graphic were significant at p<0.001.
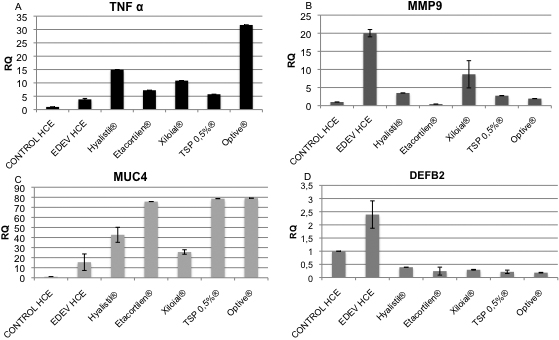
 Figure 8 of Meloni, Mol Vis 2011; 17:113-126.