Figure 3 of
Meloni, Mol Vis 2011; 17:113-126.
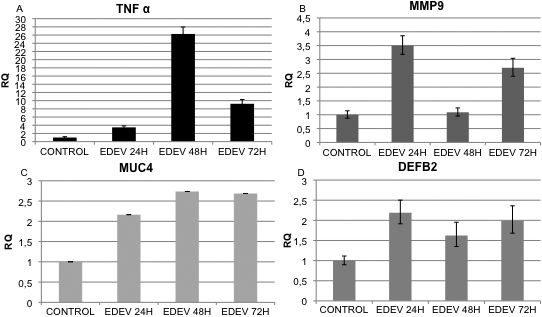
Figure 3.
Set-up of EDEV model. Real-time PCR analysis showing the relative changes of
TNF-α
(
A
),
MMP9
(
B
),
MUC4
(
C
), and
DEFB2
(
D
) mRNA Control and EDEV HCE. Values are means± SD of two different HCE tissues.
 Figure 3 of Meloni, Mol Vis 2011; 17:113-126.