Figure 2 of
Meloni, Mol Vis 2011; 17:113-126.
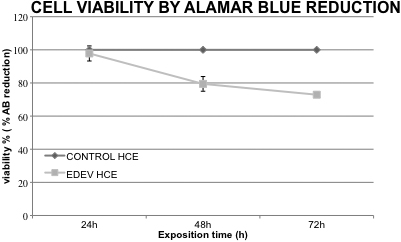
Figure 2.
Reduction of AlamarBlue (%) resulting in % viability in EDEV-HCE compared to the CONTROL-HCE at 24 h, 48 h, and 72 h. The vertical lines represent the standard deviation (SD) between two different tissues. HCE: human corneal epithelium.
 Figure 2 of Meloni, Mol Vis 2011; 17:113-126.