Figure 3. ANLN and TYRP1 expression in UM. A: The expression level of ANLN was measured by semi-quantitative RT–PCR (left panel) and western blot (right panel) in the TP31 cell line, UM primary tumors
(Tumors), and UVM. B: The expression level of TYRP1 was measured by semi-quantitative RT–PCR (left panel) and western blot (right panel) in UVM, the TP31 cell line and UM primary
tumors (Tumors). The 18S rRNA was used as an internal control of amplification (489 bp). Actin was used as a protein loading
control. Data are representative of three independent experiments.
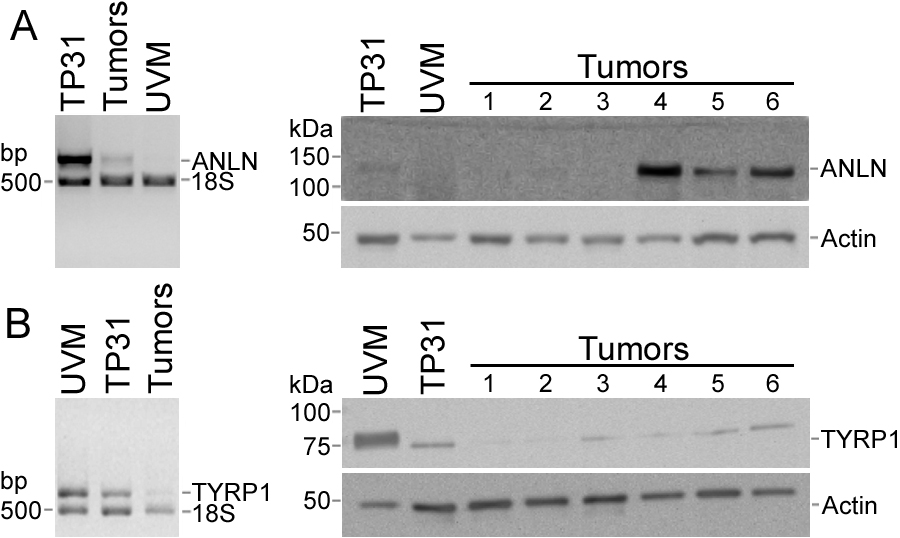
 Figure 3 of
Landreville, Mol Vis 2011; 17:1324-1333.
Figure 3 of
Landreville, Mol Vis 2011; 17:1324-1333.