Figure 2. Validation of upregulated and downregulated genes identified in the subtracted libraries. The mRNA expression level of selected
genes was measured by semi-quantitative RT–PCR in the TP31 cell line, a pool of RNA from uncultured UM primary tumors (Tumors)
and UVM. A: Upregulated genes identified in the TP31 subtracted library (ANP32E, CKAP5, DTL). B: Downregulated genes identified in the UVM subtracted library (CTSK, MTAP, TSPYL5). The 18S rRNA was used as an internal control of amplification (489 bp). Data are representative of three independent experiments.
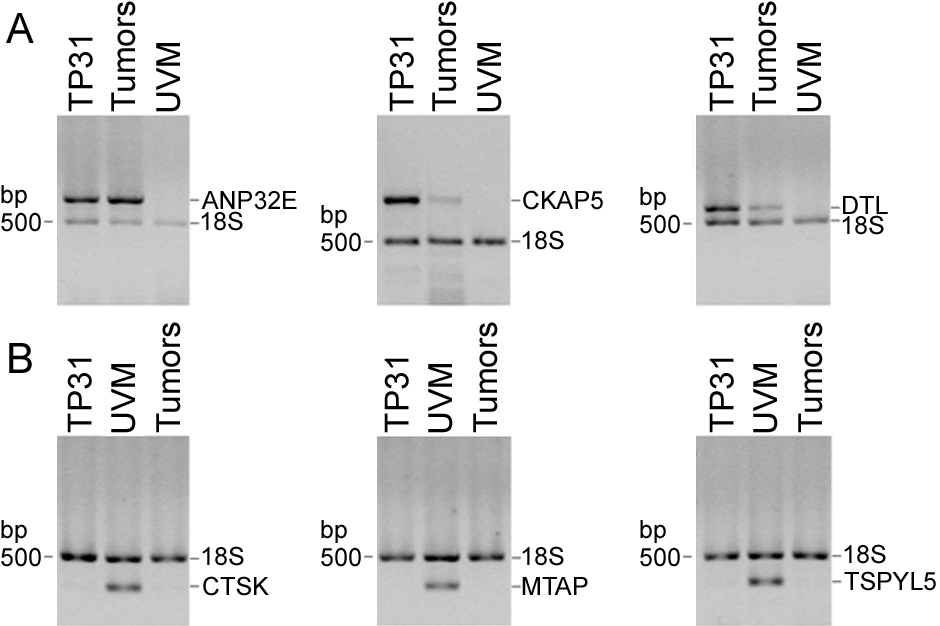
 Figure 2 of
Landreville, Mol Vis 2011; 17:1324-1333.
Figure 2 of
Landreville, Mol Vis 2011; 17:1324-1333.