Figure 3. Anxa1 protein expression in
inflammatory cells in EIU. Immunohistochemistry was performed to
visualize the protein in (A) mast cells (open arrow) and (B)
neutrophils
(arrows)
in the ciliary body at 24 h after EIU and (C)
mononuclear phagocytic cells (arrowheads) adhered to the iris surface
at 48 h after EIU. V: blood vessel. Counterstained with hematoxylin.
Bars, 10 μm. D: Semiquantitative Anxa1 densitometric analysis.
Data are the mean±SEM of the densitometric index (n=5 animals/group).
*p<0.05 versus control group; †p<0.05 versus LPS 24 h.
Neutrophils (Nϕ) and mononuclear phagocytic cells (Mϕ). ND, not
detected.
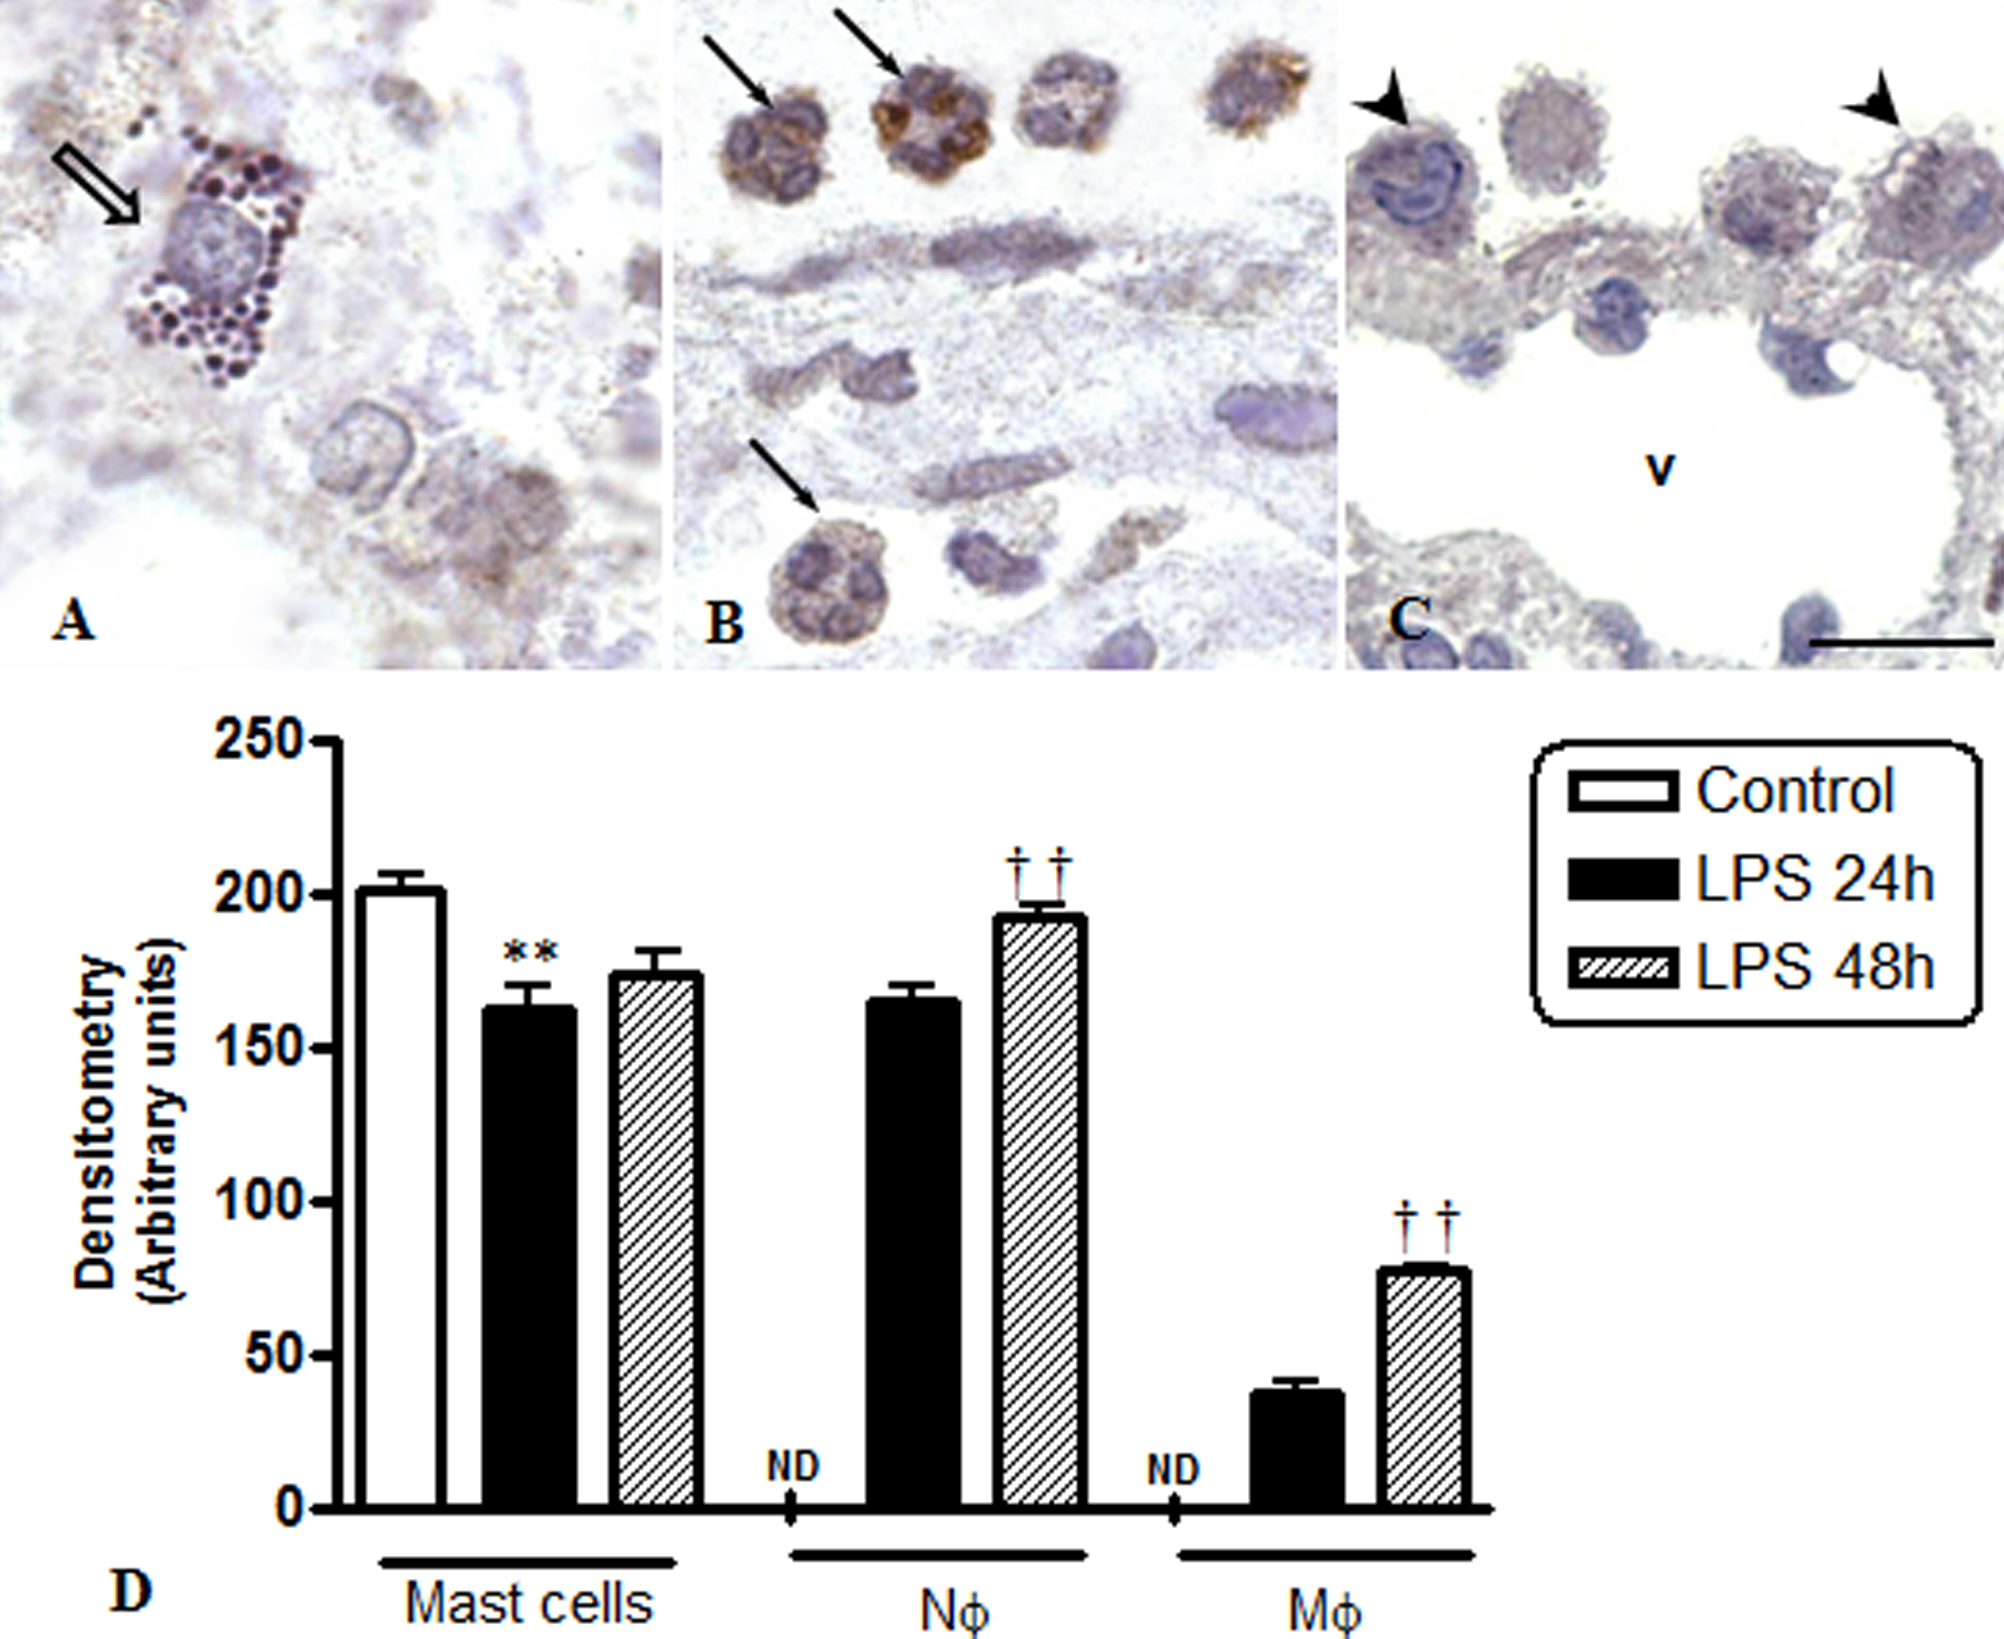
 Figure 3 of Sebastião da Silva, Mol Vis 2011; 17:1310-1319.