Figure 2. Cellular and protein
extravasations into the AqH during EIU. A: Quantitative
analysis of neutrophils (Nϕ) and mononuclear phagocytic cells (Mϕ) in
the AqH. The results are expressed as number of cells per 103/μl.
***p<0.001
versus control; †††p<0.001 versus LPS 24 h. B:
The total protein concentration in the AqH are demonstrated in mg of
protein/ml. ***p<0.001 versus control, †††p<0.001 versus LPS 24
h, ‡‡p<0.01 versus c48/80. C: Annexin A1 protein content was
analyzed by western blotting and detected by the primary antibody
rabbit anti-Anxa1. Two bands of 37 kDa and 33 kDa molecular weights
were seen corresponding, to intact protein and NH2-terminal
cleaved protein, respectively. The 55 kDa molecular weight tubulin-α
was used as control. Control animals, animals at the initial (LPS 24 h)
and late phase (LPS 48 h) of the inflammatory process, animals
pretreated c48/80 (c48/80) only, or pretreated with c48/80 before EIU
(c48/80 + LPS 24h). n=10 animals/group.
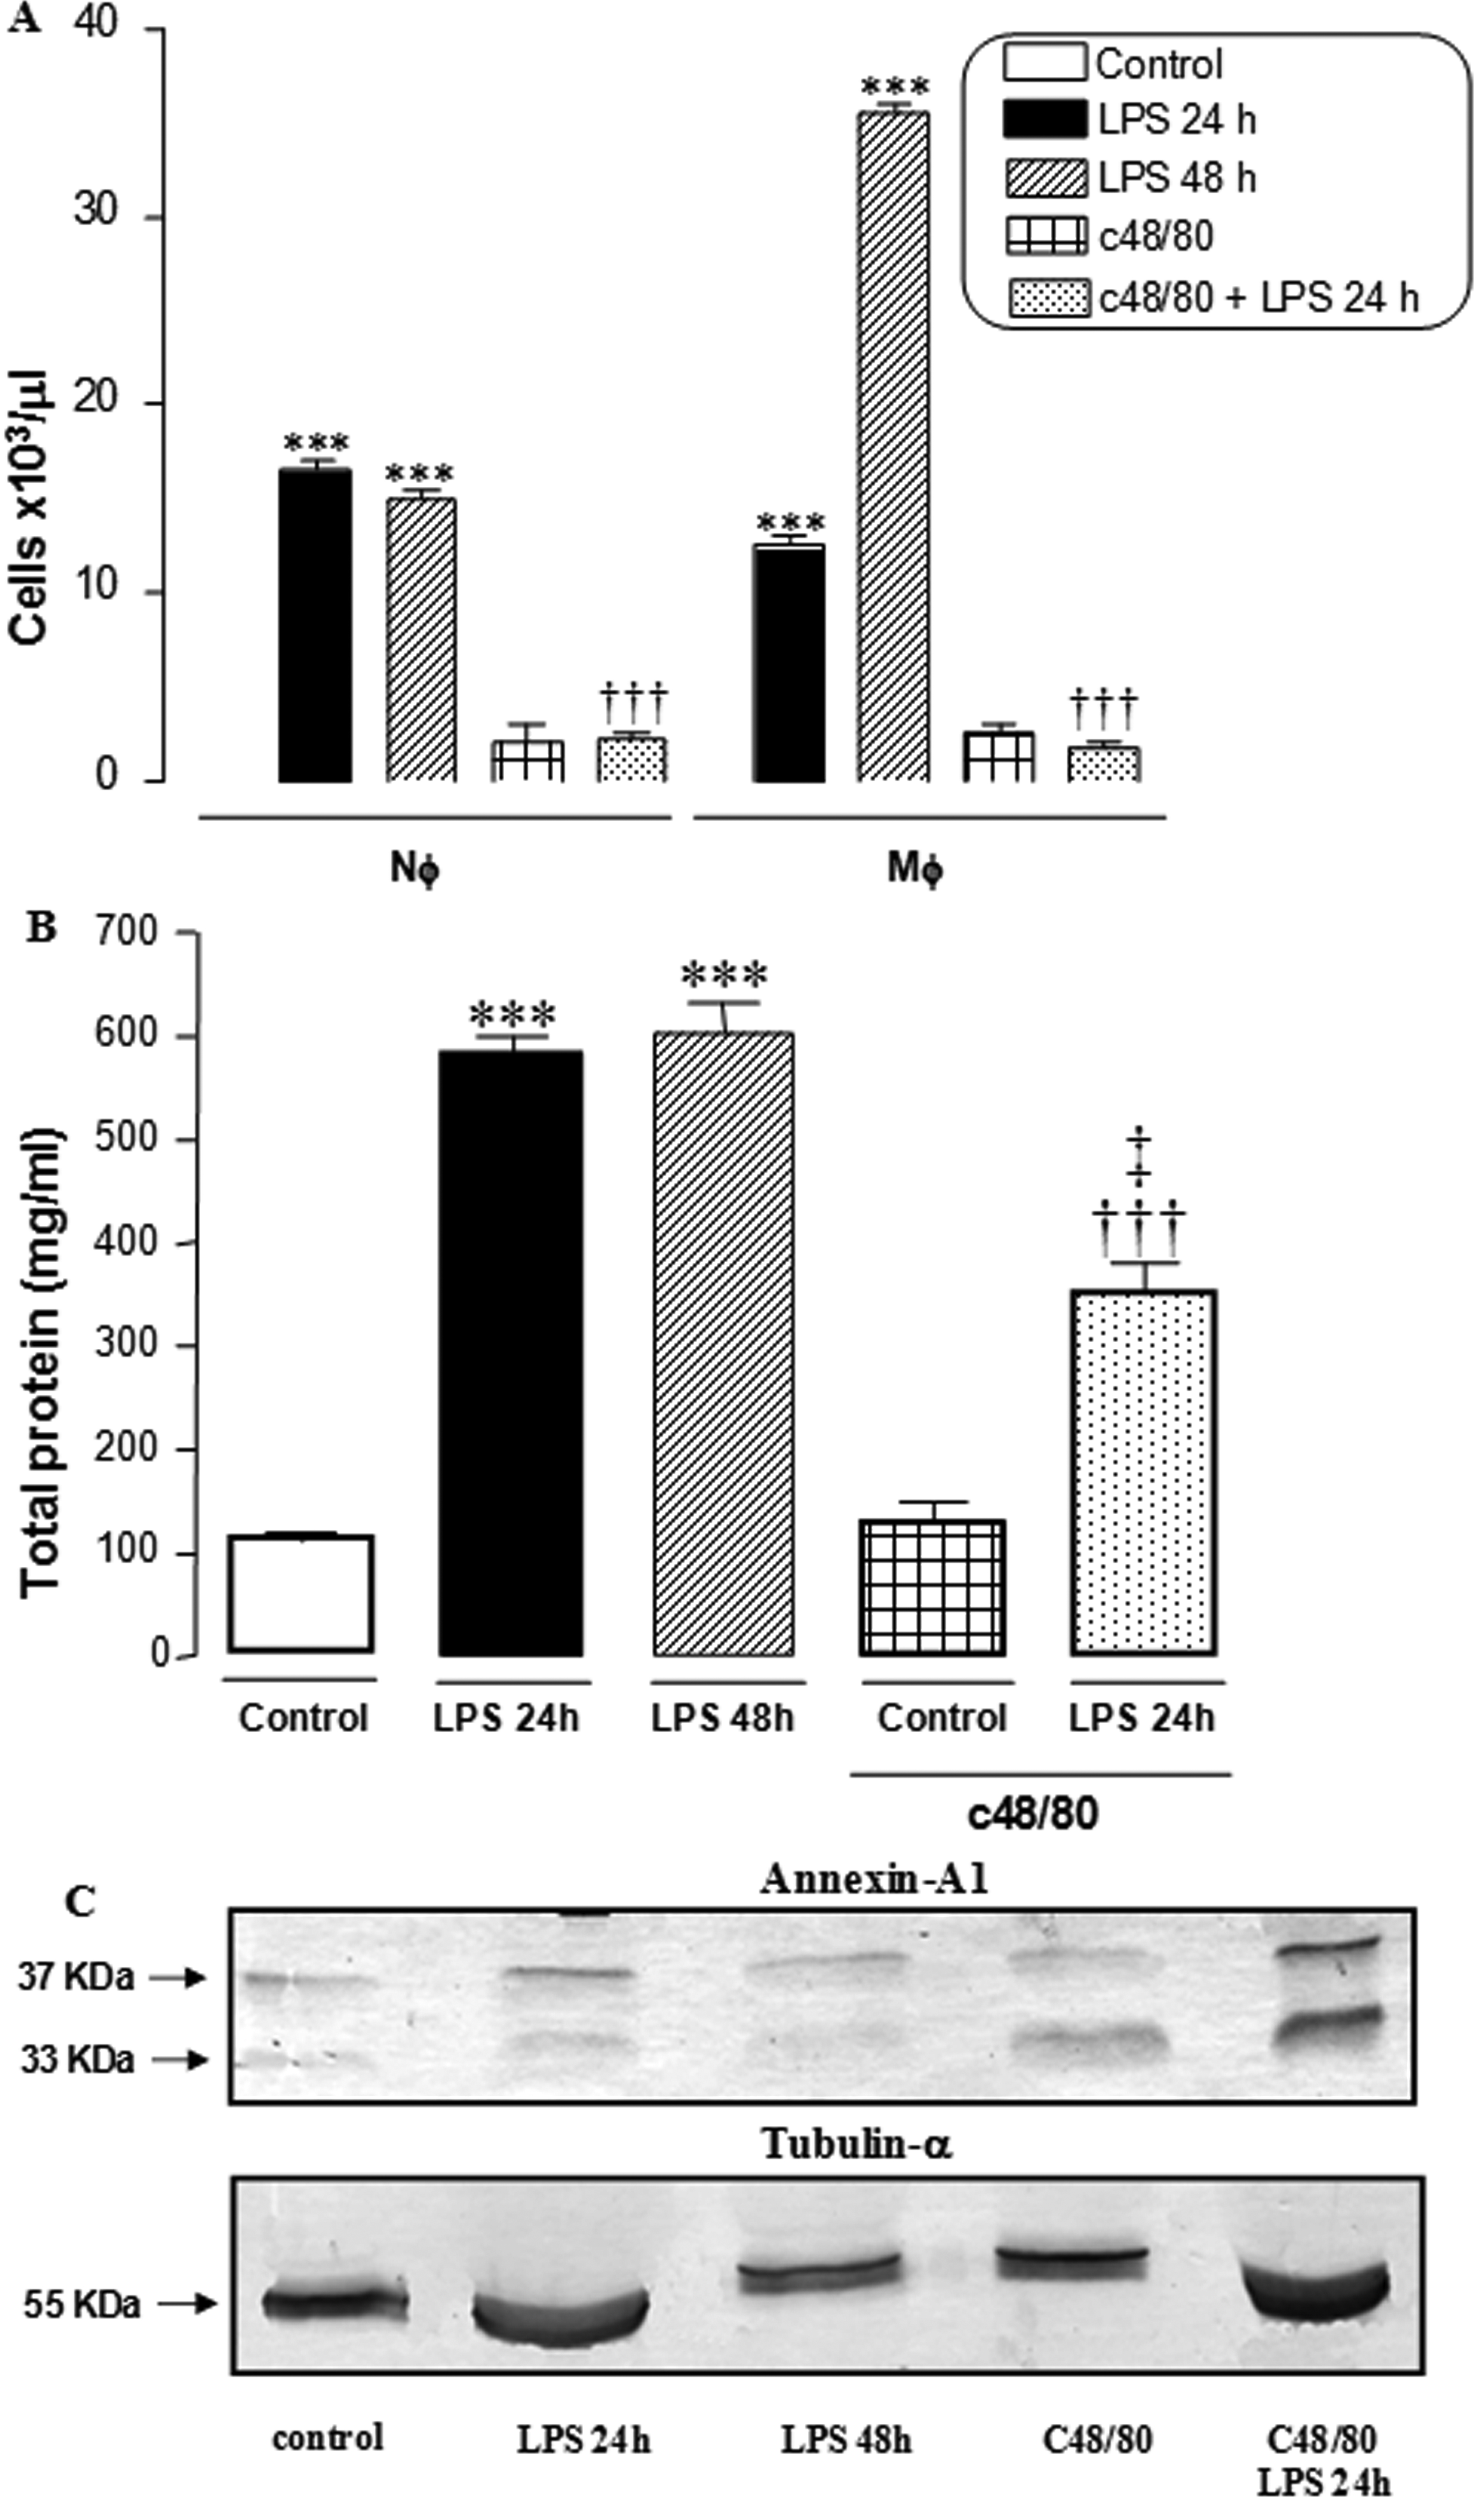
 Figure 2 of Sebastião da Silva, Mol Vis 2011; 17:1310-1319.