Figure 2. Total antioxidant capacity in
the blood, aqueous humor, and vitreous of control and diabetic
patients. The total antioxidant capacity (TAC) was measured by the
oxygen radical absorbance capacity assay in the blood, aqueous humor
and vitreous of controls (white columns) and of patients with
non-proliferative diabetic retinopathy (NPDR; gray columns) and with
proliferative diabetic retinopathy (PDR; black columns). The control
group displayed significantly higher TAC levels than diabetic
sub-groups in both the vitreous (p<0.001) and aqueous humor
(p=0.003). No significant differences were observed in blood. Similar
findings emerged from subgroup analyses. PDR patients had decreased
TACs in the vitreous and aqueous humors as compared with control
subjects (p=0.002 and p=0.003 respectively) and with the NPDR patient
subgroup (p<0.001 and p=0.032 respectively). Data are expressed in
µmol Trolox Equi/g and represent mean±standard deviation (bars). ANOVA
test analysis was used.
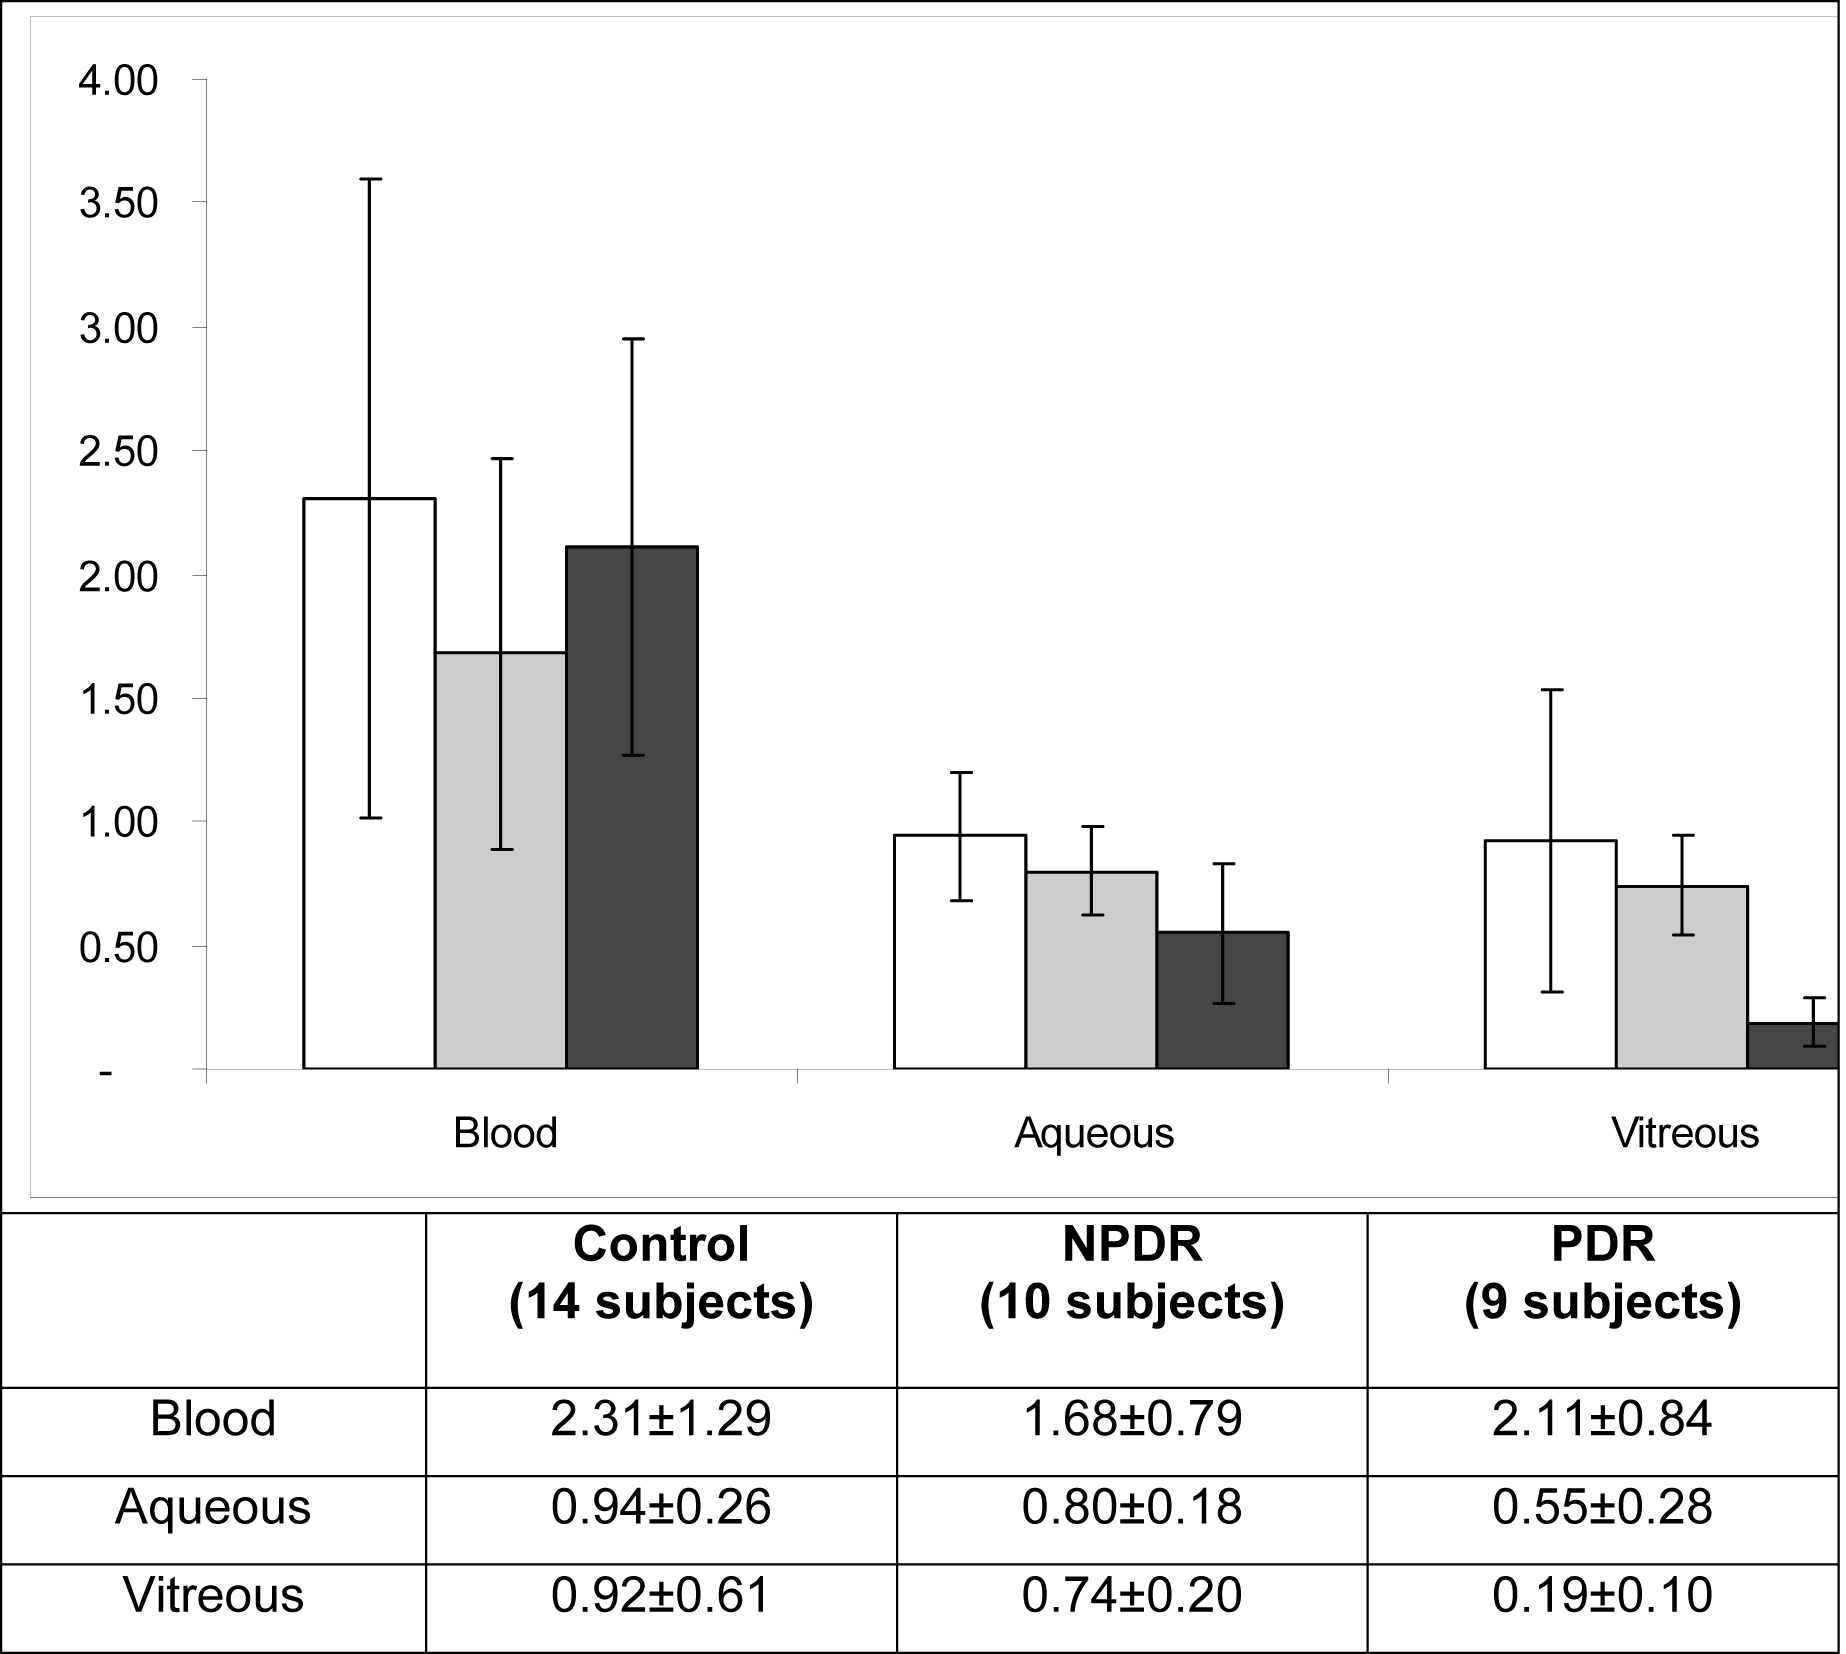
 Figure 2 of Mancino, Mol Vis 2011; 17:1298-1304.