Figure 4. Lenticular proteomics and
2D-PAGE. A: Control, B: Selenite induced, C:
selenite + FVN treated. 2D-PAGE map of selenite induced group showed
few spots are newly visible, few spots intensified and another few
diminished in intensity or had disappeared (marked in alphabetical
order from 1 to 17). FVN treated group showed normal appearance in
2D-PAGE analysis compared with control.
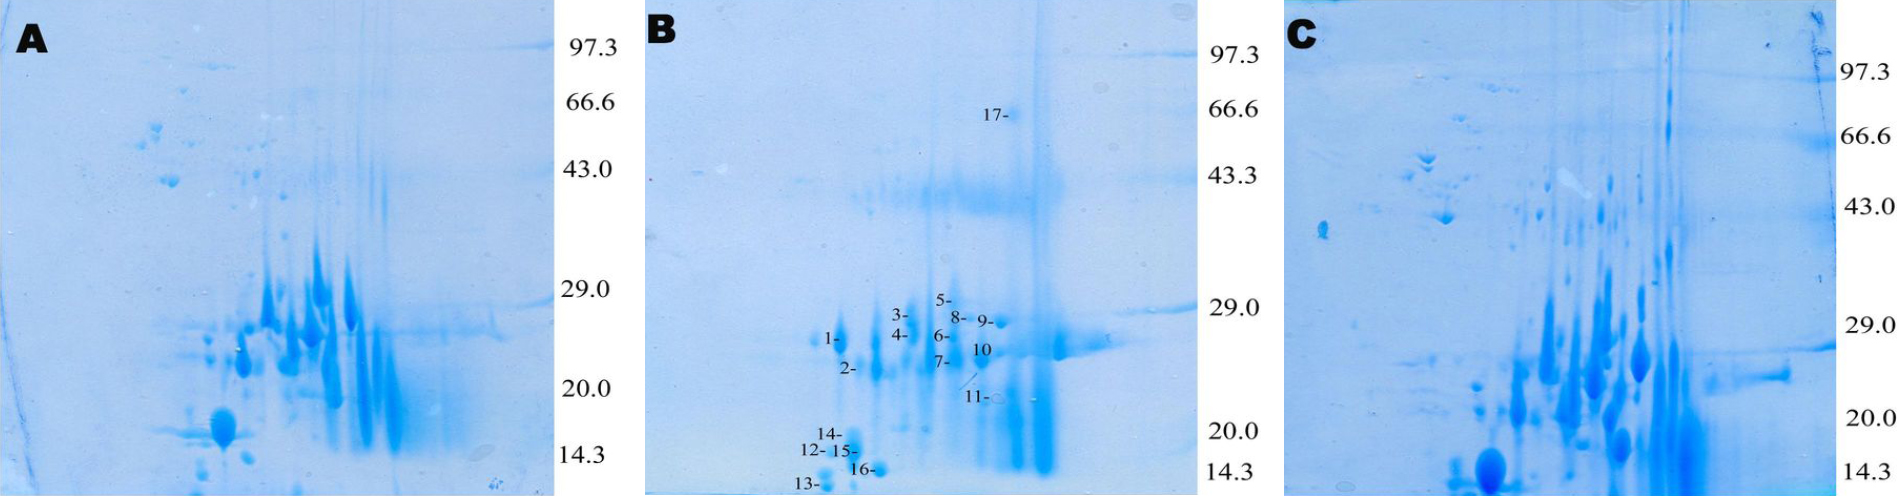
 Figure 4 of Rooban, Mol Vis 2011; 17:1239-1248.