Figure 3. Chaperone activity of α-crystallin. A: DTT induced aggregation of insulin - Light scattering of insulin in the absence of α-crystallin (curve 1), α-crystallin
from selenite induced (curve 2), α-crystallin from control rats (curve 4), standard α-crystallin (curve 5), α-crystallin from
FVN treated group (curve 3). Data are representative of three such independent assays for three separate lens extracts. B: Heat induced aggregation of βL-crystallin - absence of α-crystallin (curve 1), α-crystallin from selenite induced group
(curve 2), α-crystallin from control (curve 4), standard α-crystallin (curve 5), α-crystallin from FVN treated group (curve
3). Data are representative of three such independent assays for three separate lens extracts.
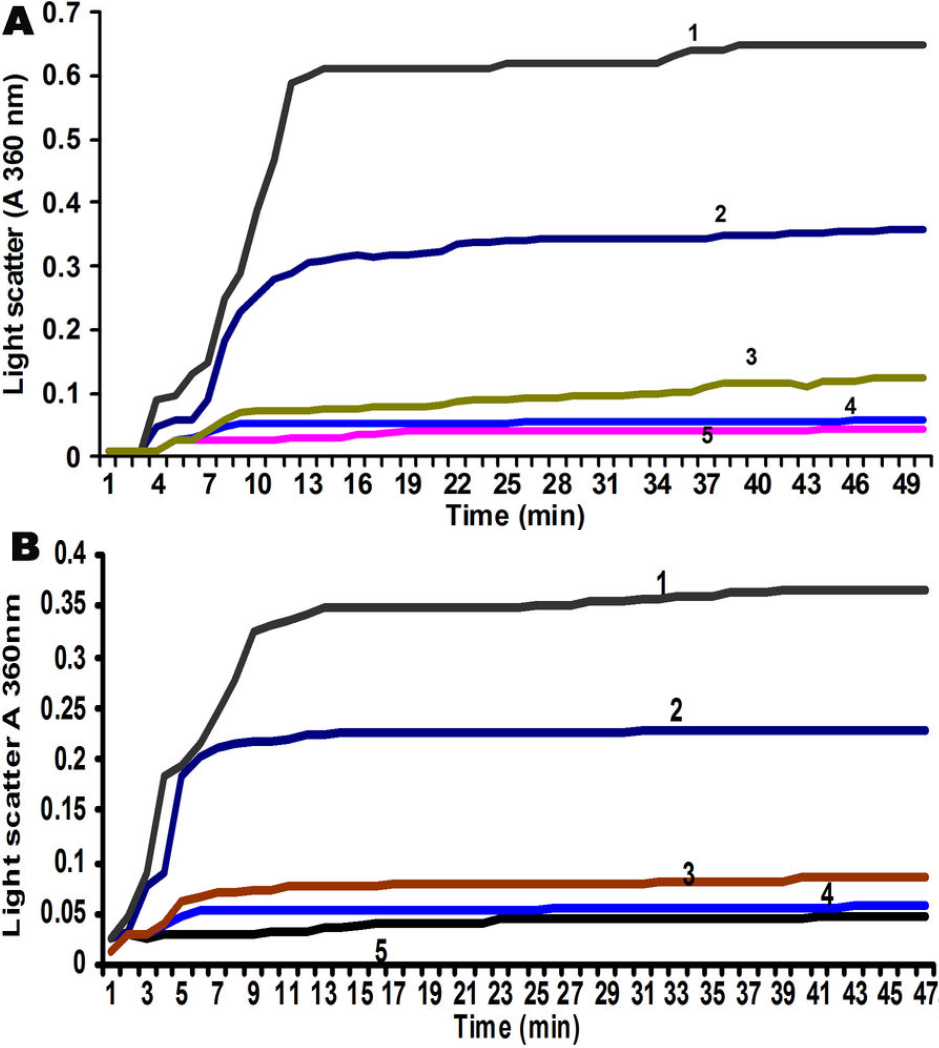
 Figure 3 of
Rooban, Mol Vis 2011; 17:1239-1248.
Figure 3 of
Rooban, Mol Vis 2011; 17:1239-1248.