Figure 1. Soluble and insoluble proteins in lens. Values are expressed as mean (n=8) ±SD. Comparison between groups, different alphabets
indicate significant difference at p<0.05. Groupings are G-I: Control, G-II: Selenite induced, G-III: Selenite + FVN treated.
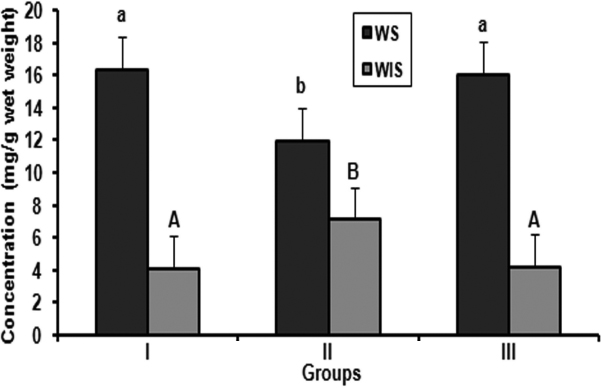
 Figure 1 of
Rooban, Mol Vis 2011; 17:1239-1248.
Figure 1 of
Rooban, Mol Vis 2011; 17:1239-1248.